Features
ArchSim has four workspaces around one canvas, switched from the top bar: Design, Test, Results and a Dashboard (keys 1, 2, 3, 4). One Simulate button (Ctrl/⌘ Enter) runs the design from wherever you are, and results land on the canvas right away. A short guided tour opens on the first visit (and from the ⋯ menu), and a hint on the canvas says what to do next, for example adding API servers behind a lone Clients box.
Results are estimates, not production guarantees. Every number comes from the model you drew and the assumptions you entered. Without calibration against real telemetry, trust comparisons between scenarios more than any single absolute value. See the simulation model and how accurate ArchSim is.
- Design: draw it with real technologies
- Test: traffic, failures and replay
- Results: answer, compare, breaking point, details
- Dashboard: a Grafana-style view of every run
- Bring your own system: calibrate, import, price, gate
- AI agents
- Teams, review and sharing
- Everywhere
- Scope and limitations
Design: draw it with real technologies#
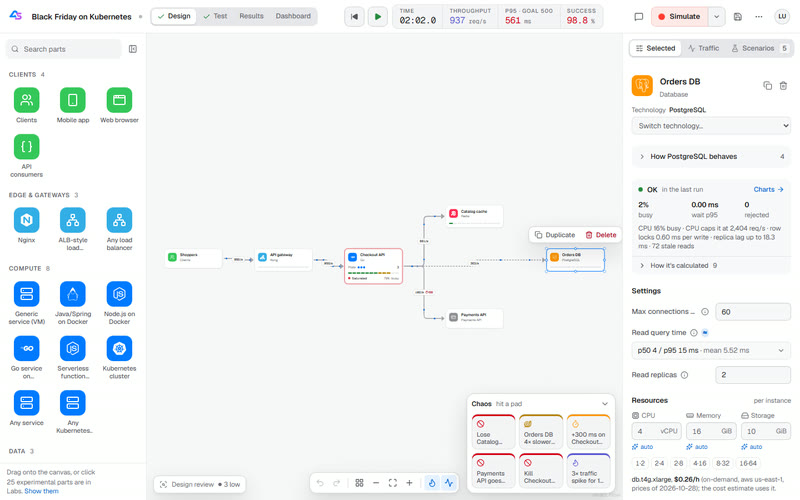
A parts library with each technology's logo and a search box: relational (PostgreSQL, MySQL, SQL Server, distributed SQL), document (MongoDB replica sets and sharded clusters), wide-column (Cassandra), key-value (DynamoDB-style provisioned throughput), search (Elasticsearch), caches (Redis, Valkey, Memcached, CDN edge, Varnish), message queues (Kafka, RabbitMQ, SQS-style...), gateways (Nginx, HAProxy, Envoy, Kong...), services on VMs, Docker, Kubernetes (HPA autoscaling, pods on a cluster's nodes) or serverless (cold starts, concurrency limits), Kubernetes clusters (EKS-, GKE- and AKS-style, k3s), and third-party APIs (payments, e-mail, identity, LLM inference...).
Each technology brings the behaviour its documentation describes.
- PostgreSQL locks rows, makes commits wait for its write-ahead log (sharing flushes between concurrent commits) and replays writes on replicas with a single worker, so heavy writes make replicas lag and serve stale reads. MySQL replays on four workers; SQL Server's reads wait for writers.
- MongoDB waits for a majority of its replica set, reads from the primary and caps concurrency with 128 tickets. DynamoDB meters capacity units and throttles a hot key at 1,000 writes per second per partition. Elasticsearch sends every search to every shard.
- Redis runs commands on one thread per shard and stalls while forking for snapshots. Kafka keeps each key in order on one partition and one consumer; RabbitMQ blocks publishers at its memory watermark; SQS delivers slow messages twice after the visibility timeout.
- Envoy answers 503 past 1,024 requests per target and nginx gives up after 60 s. Node.js runs CPU work on one event loop; JVMs pause for garbage collection and start slow until the JIT warms up; Lambda cold starts depend on the runtime and scale-out is rate limited.
- On a Kubernetes cluster every replica is a pod placed by its CPU and memory requests: when the nodes are full, new pods wait as Pending until the cluster autoscaler's node is ready minutes later, then pull their image and start. The canvas draws each service's pods (ready, starting, Pending) and the cluster's nodes, live during replay.
The inspector shows how the selected technology behaves, each behaviour links to the vendor's documentation, and every one is a setting (Auto by default) that you can override; each Auto value says whether it is documented or illustrative. assumptions.md lists every such number, generated from the code.
Core and experimental technologies. A core set comes first: generic, Node.js, Java and Go services (on VMs, containers, Kubernetes with HPA or serverless), PostgreSQL, Redis, Kafka, SQS-style queues, and Nginx and ALB-style load balancers (plus the generic part of each kind, which adds no technology behaviour). Every other technology carries an "experimental" badge in the parts library, the inspector, reports and exports: its behaviour rests on documentation and illustrative numbers. No technology is validated against measurements yet; that is the next step.
Clients as separate parts. Mobile app (iOS, Android, React Native, Flutter), Web browser (React, Next.js, Vue, Angular, Svelte) and API consumers (REST / OpenAPI, GraphQL), alongside the generic Clients box. Each has its own timeouts, retries and network latency on its link, and a traffic share: put all three in front of one gateway and the workload is split between them (50 / 35 / 15 by default). Results show success and latency per client.
Resource specs on every part. CPU cores, memory and (databases, queues) storage per instance, with one-click common sizes and an illustrative price. They change the run where it is defensible: fewer cores than workers makes CPU work queue, a service refuses requests past its memory, a database whose hot working set does not fit in memory sends reads to disk, a cache evicts least recently used keys. Left empty they are auto-sized: each part gets the CPU, memory and storage it needs for the design's peak load (CPU at a 60% target, memory for the requests, buffer cache or keys it holds, storage under 70% full), shown with how it was worked out and used in runs, prices and exports until you type your own. The engine does the sizing, so the CLI, the API and the web app simulate a design identically (same result digest).
Cards, wires and the inspector. Every part is the same card: its technology logo on a solid tile in its family's colour, its name, one or two key settings, and after a run a 12-segment level meter (green, then yellow, then red, like an audio meter) that shows how busy it was. Links are rounded wires that attach on any of the four sides: drag from a dot on any side of one part to any side of another, in either direction. Traffic moves along them while a run replays. Click a part to edit it: its technology, a one-line last-run status, at most three key settings (response-time distributions as a one-line summary you click to edit), and "More settings" for everything else, notes and what the model covers.
A design review flags single points of failure, missing timeouts, retry amplification along a path, timeout inversions, connection-pool exhaustion and more, with the numbers.
Export the design as docker-compose, Kubernetes manifests (Deployments, Services, HPAs, StatefulSets) or Mermaid, as reviewed starting points.
Test: traffic, failures and replay#
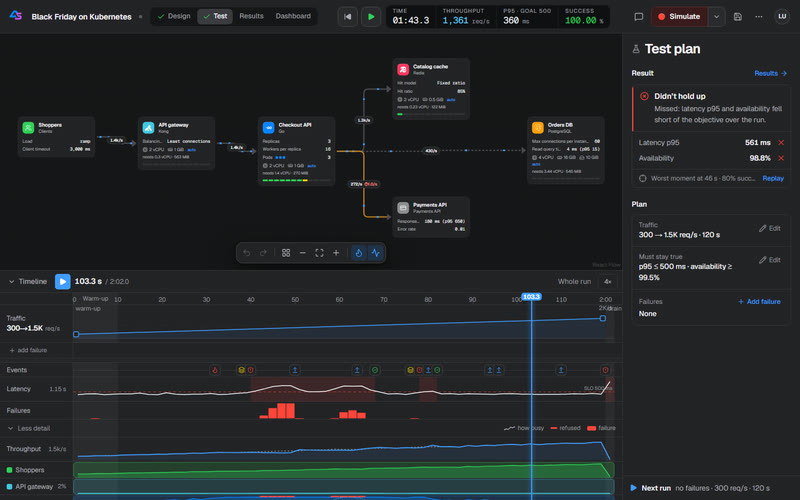
- One test plan. The Test plan panel holds the last result and one plan card with three rows: Traffic, Must stay true (your objectives) and Failures. "Add failure" offers quick tests generated from the design ("lose the cache for 15 s", "database 4× slower", "+300 ms on a link", "3× spike") and custom outages, slowdowns and link latency. You can also drag the traffic line and the failure blocks on the timeline.
- Chaos pads on the canvas plan a failure and simulate in one hit.
- Replay every second. Every run is recorded second by second and replays on the canvas: each component's utilization, queue and traffic at that second. The timeline below stays short: play, the time, speed, the traffic plan, events, latency against the objective and failures; "More detail" adds throughput and a heat lane per component.
- A verdict for every test against its objectives (what must stay true), including what happened during each failure.
Results: answer, compare, breaking point, details#
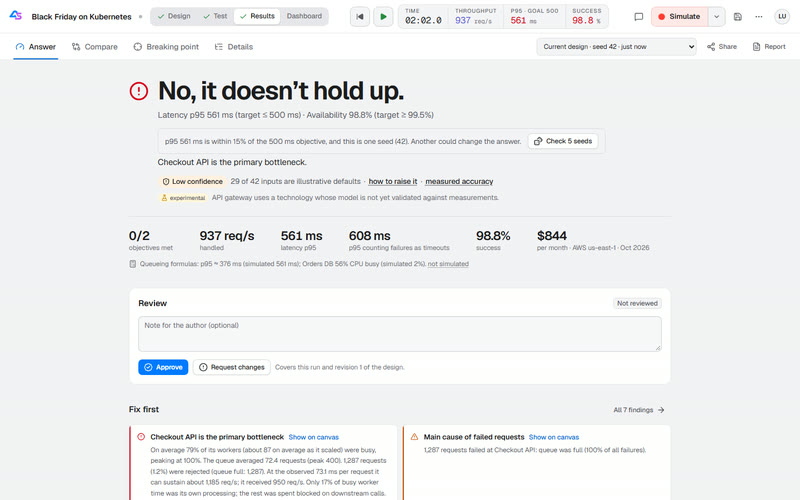
- Answer: one sentence ("Yes, it holds up." or "No, it doesn't hold up." with the objective that failed and the bottleneck), the key numbers, what to fix first, objective tiles with editable targets, and monthly cost from per-component cost assumptions.
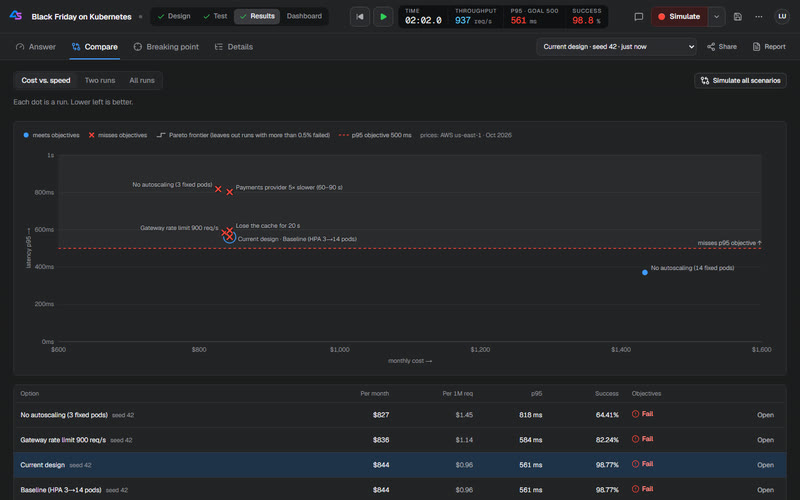
- Compare: cost against latency for every run and scenario (Pareto frontier, objective line), two runs side by side with the exact input differences, and the run history.
- Breaking point: stepped load sweeps that find where latency turns into a hockey stick and the highest load that still meets the objectives.
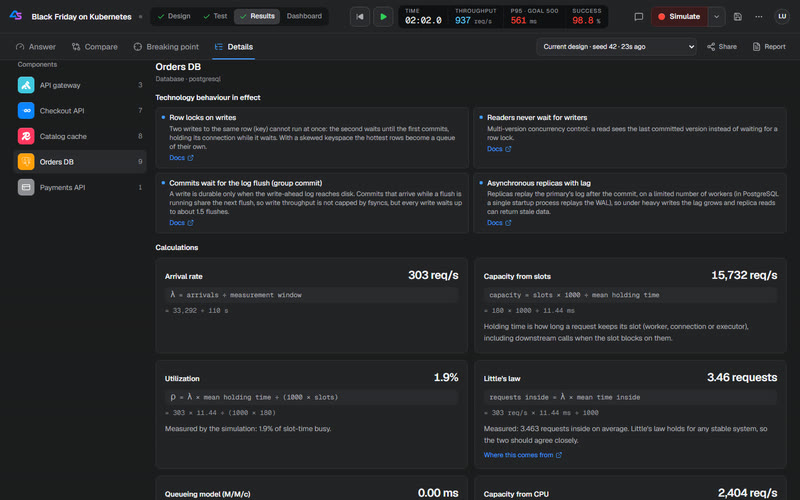
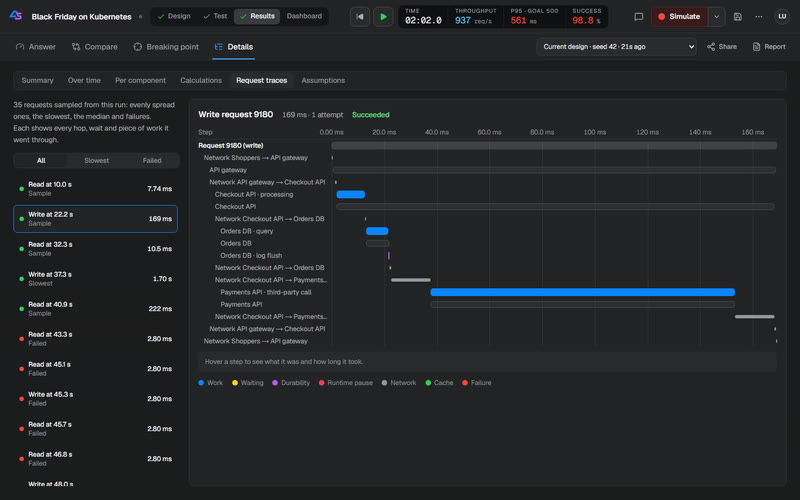
- Details: findings in plain language (bottlenecks, hot shards, hot rows, replica lag, throttling, autoscaling lag, consumer lag, wasted work), error budget, metrics over time, per-component drill-down, Calculations and Request traces, and the assumptions behind every number. A Markdown report is one click away.
Calculations shows the maths behind the numbers: each formula written out, again with the run's own values, and the result, next to what the simulation measured (utilization, Little's law, the M/M/c queueing prediction, the hottest row's lock, group commit, replica replay capacity, DynamoDB partitions, event-loop capacity...), plus where a typical request's time goes. The same formulas fold out under the selected part in Design.
Request traces follows about thirty sampled requests (evenly spread, the slowest, the median, failures) through every hop, wait, lock, log flush and GC pause on a waterfall.
Dashboard: a Grafana-style view of every run#
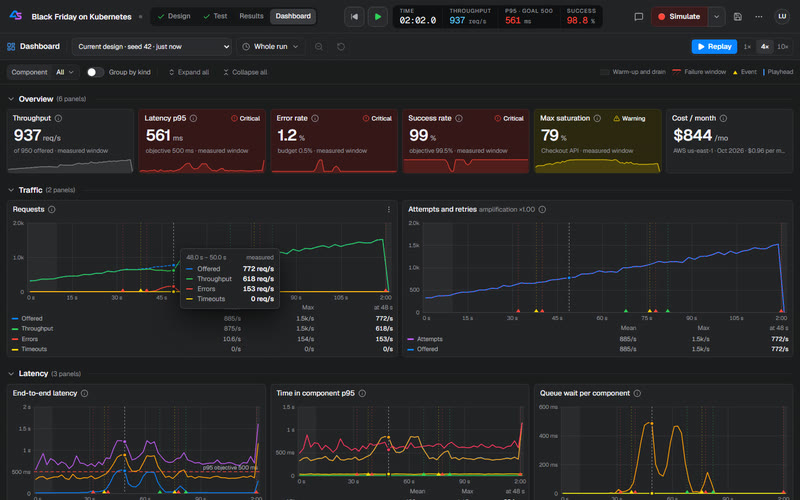
- Rows of panels for the overview (throughput, p95 against the objective, error and success rate, the most saturated part, monthly cost), traffic, latency, saturation and errors, then one row per component with its own signals: replication lag, lock and commit waits, consumed capacity units, evictions, partition lag, redeliveries, GC pauses, event-loop lag, warming replicas, 504s and 503s.
- A crosshair synced across every panel, table legends you can click to isolate a series, drag-to-zoom on any chart, warm-up and failure windows as annotations, fullscreen and "Inspect data" (table and CSV) per panel, and Replay at 1x/4x/10x that draws the run live, shared with the Test workspace. Each panel's info popover says how its value is calculated.
Bring your own system: calibrate, import, price, gate#
- Calibrate from your telemetry. Prometheus metrics (with a mapping file) or an OpenTelemetry
trace export set service times, hit ratios, link latency and the traffic curve; each input is
marked measured with its source, query, time range and fit error, and the calibrated model
replays what was observed and reports its largest error, not only p95. The bundled fixtures are
generated by ArchSim itself, so they show the method, not real-world accuracy. Ctrl/⌘ K →
Calibrate from telemetry, or
archsim calibrate. See calibration.md. - Import what you run. A docker-compose file, Kubernetes manifests or a Terraform plan become a
design, with a report of what was mapped, what was guessed (marked assumed), what was ignored and
which links to confirm. ArchSim's own exports come back with the same structure (parts,
technologies, replicas, autoscaling, links); timings, hit ratios, timeouts, workload and
scenarios do not. Menu → Import from compose, Kubernetes, Terraform, or
archsim import. See import.md. - Prices from real machines. A design names a price snapshot (provider, region, date): parts then run on the cheapest real instance type that fits them and every cost line cites it. ArchSim ships AWS us-east-1 on-demand list prices (EC2, RDS, ElastiCache, MSK, EBS, Lambda, SQS, ALB), refreshed monthly; templates and new projects use them, and every dollar figure names its source. Designs saved without a snapshot keep the generic illustrative rates. See pricing.md.
- An SLO gate in CI.
archsim checkfails a pull request when a design misses its objectives or regresses against the base branch (p95, success rate, cost, breaking point), and a GitHub Action posts one sticky comment with the comparison. See ci.md.
AI agents#
- In the browser (WebMCP). The app registers WebMCP tools, so an agent in your browser can open a template, read the design, add and connect parts, set traffic and objectives, run the design review, simulate and read the verdict, without clicking. Every agent edit shows on the canvas, is announced in a toast and can be undone. WebMCP is an experimental draft standard; see agents.md for the tools and browser support.
- In your coding agent (MCP).
archsim-mcpis an MCP server over stdio for Claude Code, Claude Desktop, Cursor and others: list part types and templates, validate, analyze, simulate (with the verdict, findings and result digest), compare, find the breaking point, export, import and calibrate, with the engine's limits and no browser or API server. Setup: getting-started.md and agents.md.
Teams, review and sharing#
Locally there is no sign-in: you are the owner of one default workspace. With sign-in on
(deployment.md), people sign in with GitHub or
Google, work in personal and team workspaces as viewers, editors or owners, and make API tokens for
the CLI, CI and MCP. Anyone in a workspace can comment on parts, links and runs, resolve threads and
sign off a run; every change is recorded in the project's history. A share link is a frozen,
read-only copy of one run's results that anyone with the link can open. The endpoints are in
api.md.
Everywhere#
- A command palette (Ctrl/⌘ K) with every action, and keyboard shortcuts.
- A "Studio" look, modelled on pro audio and design apps: charcoal panels, part families in Apple's system colours, a dot-grid canvas, and a transport bar at the top with replay buttons and an LCD readout (time, throughput, p95 against the goal, success) next to a red record-style Simulate button; on screens narrower than 1440 px the readout leaves out the throughput, and a long project name ends in an ellipsis rather than crowd the bar. The replay timeline shows one arrangement lane per part, in its family colour. Dark by default, with a matching light theme: the sun/moon button at the top right picks one or follows the system; below 1536 px the ⋯ menu switches between them instead (ui-redesign.md).
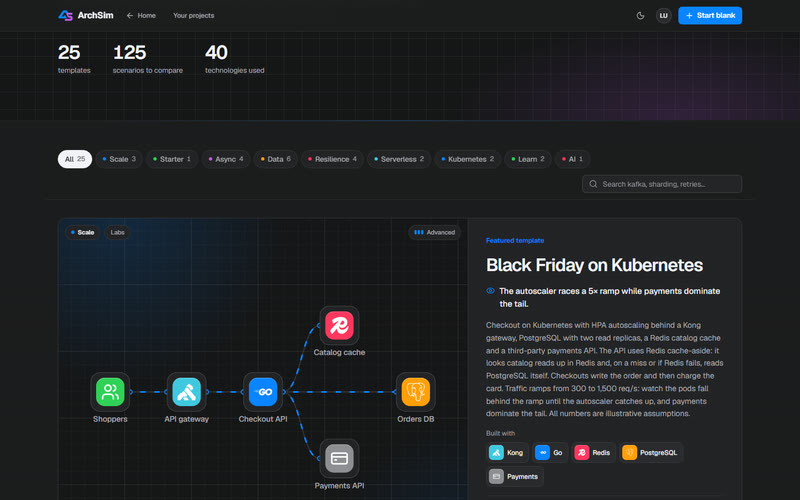
- A templates gallery (
/templates): each card draws the design with its technology logos and flowing traffic, says what you will see happen, its level and key numbers, with category filters, search and a featured template. Your saved projects are on their own page (/projects). - Projects live in PostgreSQL, documents import and export as versioned JSON, and every run stores its input, seed, engine version and result digest so it can be re-run and verified bit for bit.
Scope and limitations#
Supported today: several client groups per design (Clients, mobile app, web browser, API consumers) sharing one workload; load balancers, services (with autoscaling and serverless), caches, databases, message queues and external APIs; synchronous acyclic call graphs; open-loop synthetic workloads; scheduled faults (outage, slowdown, link latency); local use without sign-in, or GitHub/Google sign-in with workspaces, roles and API tokens; optional CPU, memory and storage specs (CPU contention, memory limits, database buffer cache, LRU cache eviction); the technology behaviours listed above (row locks, write-ahead-log flushes, GC pauses, cold starts and so on).
Not modeled: OOM kills and restarts, disk and network bandwidth, packet loss, deadlocks and range locks, random failures (faults are scheduled), parallel fan-out calls, regions. The full list is in simulation-model.md.
Not built yet: Grafana integration and an HTTP transport for the MCP server are on the
roadmap; AI agents can use the stdio MCP server and, in the browser, the WebMCP
tools. A hosted stack and a full deploy guide are still to come: without
ARCHSIM_AUTH_MODE=oauth there is no authentication, so keep it on your machine, and read
SECURITY.md before exposing a server. Progress is tracked in
IMPLEMENTATION_STATUS.md.
The screenshots on this page were taken on 27 October 2026, before the current logo and some later interface changes.