How accurate is ArchSim?
ArchSim predicts latency and capacity from a model. This page checks those predictions against
real systems running on one machine: for each stack, the model is calibrated from low-load runs,
ArchSim predicts every higher load before it is measured, and then k6 measures it. The tables
show the latest run of each experiment, good or bad. benchmarks/results/ keeps the calibration,
the predictions and every measured repeat's numbers as extracted from k6's end-of-run summary; the
k6 summaries themselves are scratch output and are not committed.
Headline#
| Experiment | Sample | Knee measured | Knee predicted | Knee error | p95 error at or below the measured knee (median / worst) |
|---|---|---|---|---|---|
| java-mixed | held out | 4,650 req/s | 7,907 req/s | +70% | 22% / 41% (2 steps) |
| go-mixed | held out | 5,950 req/s | 9,916 req/s | +67% | 26% / 47% (2 steps) |
| python-mixed | held out | 1,388 req/s | 1,762 req/s | +27% | 88% / 164% (3 steps) |
| chain | held out | 3,388 req/s | 4,455 req/s | +32% | 54% / 91% (3 steps) |
| cache-ttl | held out | 5,420 req/s | 5,104 req/s | -6% | 37% / 58% (5 steps) |
| pg-mixed | tuned on | 4,483 req/s | 5,203 req/s | +16% | 16% / 81% (3 steps) |
| pg-hot-row | tuned on | 947 req/s | 857 req/s | -10% | 13% / 10003% (6 steps) |
| cache-aside | tuned on | 6,752 req/s | 5,652 req/s | -16% | 22% / 17808% (6 steps) |
| kafka | tuned on | 2,387 req/s | 2,090 req/s | -12% | 57% / 5268% (6 steps) |
Runs that repeat each experiment's latest conditions:
| Experiment | Sample | Runs repeating the latest | Median knee error | Knee errors | Measured knee inside the predicted range |
|---|---|---|---|---|---|
| java-mixed | held out | 3 (v6, engine 0.16.0) | +70% | +64% to +89% | 0 of 3 runs (nominal 80%) |
| go-mixed | held out | 3 (v6, engine 0.16.0) | +67% | +58% to +73% | 0 of 3 runs (nominal 80%) |
| python-mixed | held out | 3 (v6, engine 0.16.0) | +29% | +27% to +30% | 3 of 3 runs (nominal 80%) |
| chain | held out | 3 (v6, engine 0.16.0) | +30% | +24% to +32% | 3 of 3 runs (nominal 80%) |
| cache-ttl | held out | 3 (v6, engine 0.16.0) | -6% | -8% to +1% | 3 of 3 runs (nominal 80%) |
| pg-mixed | tuned on | 6 (v6, engine 0.16.0) | +16% | +6% to +88% | 5 of 6 runs (nominal 80%) |
| pg-hot-row | tuned on | 5 (v6, engine 0.16.0; 1 disturbed, not counted) | -10% | -10% to -9% | 5 of 5 runs (nominal 80%) |
| cache-aside | tuned on | 6 (v6, engine 0.16.0) | -23% | -27% to -1% | 5 of 6 runs (nominal 80%) |
| kafka | tuned on | 5 (v6, engine 0.16.0; 1 disturbed, not counted) | -3% | -12% to +10% | 5 of 5 runs (nominal 80%) |
The tier criteria below judge the median over at least 3 such runs. The nominal coverage is how often the measured knee should fall inside the predicted range. Engine 0.14.0's runs took the range from their three replicate calibration sets ((R - 1) / (R + 1) = 50%), which leaves out how much a calibration moves from one day to the next and the model's own error; since W28 the range is an 80% one that carries both (Protocol, step 3). A disturbed run missed the objective at one load step and met it at a higher one; it is kept and listed under the run history, but not counted.
The knee is the load where the ladder first misses the objective (p95 at most 50 ms with at least 99% of requests successful), interpolated between that step and the one below it; the predicted knee uses the same steps and the same interpolation. A run that met the objective again higher up was disturbed and is not counted (see Protocol, step 5). The p95 error covers the steps at or below the measured knee: error = (predicted - measured) / measured.
Read these numbers as runs on one laptop, three to six per experiment:
- Held out: one of five predicted within 25%. Engine 0.16.0 was frozen on 2 Nov 2026 and predicted the five held-out experiments before any of them was measured; each then ran three times on 3-4 Nov. Median knee errors: cache-ttl -6%, python-mixed +29%, chain +30%, go-mixed +67% and java-mixed +70%. Only cache-ttl meets criterion 1 (within ±25%); python-mixed and chain miss it by about five points.
- On stacks it was not tuned on, ArchSim promised too much capacity. Four of the five predicted knees are above the measured ones, the unsafe side: a design sized on them runs out of headroom sooner than predicted. The CPU those stacks cost is predicted well (busy cores at the highest step below both knees within 8% for every held-out part except cache-ttl's service and Redis, +22% and +25%), so the error is in how that CPU turns into capacity. One lead, not checked yet: java-mixed, go-mixed and python-mixed ran on the two hyperthreads of one physical core, which the model counts as two full cores, and on this laptop a thread that shares its core runs at about half speed (Environment); the gap was written down before they were measured (Held-out experiments). chain, whose services had a core each, is +30% too, so that is not the whole story. Model work waits until the Java port is done (ADR 0017).
- The predicted range held 9 of the 15 held-out runs, against a nominal 80% (12 expected). Every miss is java-mixed's or go-mixed's: in all six of their runs the measured knee fell below the range's low end (java-mixed's latest: 4,650 req/s against a range from 5,926). Fifteen runs are too few for the coverage check to reject 80% at 5%, but misses gathered in two experiments are a bias, not bad luck. On the tuned-on experiments the range held 20 of 22 runs. It is wide, about x0.75 to x1.33 of the predicted knee.
- cache-ttl meets criteria 1, 2 and 3a: median -6%, every step's p95 within a factor of two or 3 ms at or below the knee, and no unstable step. Only criterion 3b, a second machine, is missing: it is the first experiment to pass everything one machine can show.
- Tuned on: six runs each under engine 0.16.0 (the v6 campaign of 1-2 Nov and a repeat on 4
Nov), median knee errors Kafka -3%, pg-hot-row -10%, pg-mixed +16% and cache-aside -23%. The
plan's in-sample target was ±15%: Kafka and hot-row meet it, pg-mixed and cache-aside do not.
These four are in-sample: the protocol (up to v6) and the engine (up to 0.16.0) were developed
with their results in view. The first hot-row and Kafka runs of 4 Nov were disturbed and are not
counted. Kafka's third run stopped its calibration staircase at 406 req/s instead of about
1,000: that pass implied half the consumers' capacity at about 210 req/s, under the next step
(
run.next_rise), so it predicted 2,088 req/s against 2,675 and 2,725 in the other two (-12% against the measured knee). pg-mixed's first run of 4 Nov, the first experiment after Docker Desktop had been restarted, measured 2,875 req/s against 4,371 and 4,483 in the other two (+88%); its repeats swung as in no other run (2,658 to 3,869 req/s served at 4,050 offered), but it never met the objective higher up, so the rule counts it. Without it the median is +16% too. - Tuned on, ArchSim errs on both sides. It over-predicts pg-mixed's capacity (+6% to +19% in five of its six runs) and under-predicts cache-aside's (-27% to -1%: safe, but it would buy too much). The causes are under Where the model is wrong: pg-mixed's latency climbs before its core fills, and cache-aside's cost per request keeps falling above the calibration staircase.
- Not all of engine 0.16.0's gain over 0.14.0 is the model's. pg-mixed's prediction barely moved between the baseline campaign (v5, 30-31 Oct) and the v6 campaign (4,729 to 5,003 req/s, then 4,780 to 5,055); its real knee rose about 10% (3,783 to 4,160, then 4,237 to 4,495) on the same laptop, OS build and power mode, with nothing on its path made cheaper. Kafka's real knee rose because the broker's healthcheck, which held every earlier Kafka run, is gone (2,028 to 2,132, then 2,614 to 2,802 req/s), so the v6 runs are the first that measure Kafka. Cache-aside's and hot-row's predictions did move: v6's higher staircase (cache-aside) and engine 0.15.0's database inputs (hot-row).
- Criterion 2 (p95 within a factor of two or 3 ms at or below the measured knee) holds for cache-ttl, java-mixed and go-mixed; java-mixed's and go-mixed's knees came so early that only two light steps are judged. python-mixed misses at 440 req/s (6.1 ms predicted, 2.3 measured), chain at 3,338 req/s, and every tuned-on experiment misses near its knee. pg-mixed and hot-row also miss criterion 3a (an unstable step at or below the knee in more than one run in three). See Proposed tier thresholds.
- Light-load latency. At a quarter and half of the predicted knee ArchSim's p95 is within 0.6 ms for pg-mixed, hot-row and cache-aside (cache-aside's earlier 2 to 3 times too high is gone since W29 anchored the service time's spread to the calibration pass: 0.00 and 0.09 ms off), and Kafka's is 0.36 and 1.45 ms under. Held out, it is within 0.7 ms at a quarter of the knee for all but python-mixed, whose p95 is predicted 2.6 and 1.9 times too high (6.1 and 5.9 ms against 2.3 and 3.1). At half the predicted knee java-mixed, go-mixed and chain are 1.2 to 2.9 ms under, because there they were already near their real knees.
- Two model features stay off. Re-simulated on the 12 v6 runs (in-sample,
docs/validation/dev-checks.mdfor the defaults): W26's extension of the CPU curve above the staircase moves almost nothing (cache-aside -25% to -23%, the rest unchanged; v6's staircase already reaches about two thirds of the core), and W27's shared machine takes pg-mixed from +11% to 0% but cache-aside to -34% and Kafka to -27% (median absolute error 10% to 14%), with k6's CPU and the machine's background still assumed, not measured. - Nothing is validated. No experiment meets all the proposed tier thresholds: criterion 3b needs a second machine.
The Java engine#
Re-simulated, in-sample: engine 1.1.1 (Java) re-simulates every kept calibration with exactly 0.16.0's knees (65 of 65); the latest predictions shown are 0.16.0's, which 1.1.1 reproduces (java-parity.md).
Reproduce#
Each stack is one command (Docker and a Java 25 needed: the harness, archsim-benchmarks, runs
the engine in its own process,
ADR-0068; 20 to 30
minutes per experiment on the machine below). Keep the machine otherwise idle while it runs: other work
shows up in the measurements (see the protocol history). On a Windows laptop, keep it on mains
power and set the power mode to Best performance: the runner records the mode, and runs under
different modes are not compared with each other:
./gradlew :archsim-benchmarks:run --args="postgres"       # pg-mixed and pg-hot-row
./gradlew :archsim-benchmarks:run --args="cache"          # cache-aside
./gradlew :archsim-benchmarks:run --args="kafka"          # kafka
./gradlew :archsim-benchmarks:run --args="java-mixed"     # a held-out stack: needs a frozen engine (below)
./gradlew :archsim-benchmarks:run --args="all --runs 3"   # three independent runs of each, rotating
./gradlew :archsim-benchmarks:run --args="report --json"  # rewrite this page's tables, charts and accuracy.json
make benchmark runs all of them. The harness's compare recomputes every
comparison.json from the committed measurements and predictions without Docker;
resources first predicts CPU and memory for results whose predictions have none
(see Resources). Results depend
on the machine: rerun on yours before quoting numbers. --archive first moves each
experiment's latest results into its next run-N/ folder, so the history below keeps them.
Three commands check the model and the machine rather than measure accuracy:
resimulatederives every kept run's inputs again from its calibration passes, with today's code, and simulates its measured steps with today's engine (no Docker, about 10 minutes). It writesresults/dev/<engine>/, andreport --devturns that intodocs/validation/dev-checks.md: each run's knee, measured and simulated by every engine checked. These checks are in-sample, designed after the measurements were seen, so they show what a model change does without claiming accuracy; this page's tables never use them. With engine 0.14.0 they reproduce every run calibrated under v3 or v4 exactly, step by step, which shows the re-simulation itself is faithful.envcheckcharacterises the machine (about 8 minutes of Docker): which CPUs share a physical core inside Docker's VM, how much CPU the VM loses to steal, and the service's and PostgreSQL's CPU per request and p95 across 50 to 1,600 req/s, with k6 on the CPUs the runner gives it and again with the service's physical core left to the service alone. It writesresults/envcheck/<time>.json. Each run'senvironment.jsonalso records how its cpusets fall on physical cores (topology).contentionmeasures how this machine turns CPUs into capacity (about 12 minutes of Docker): pg-mixed's service at rest, from a quarter of its core to past it and at half of it with background work on the other CPUs, with k6's own CPU; then a fixed unit of V8 work on one CPU, alone and with its hyperthread sibling, other cores or every CPU busy, and at a part of its own time. Windows' counters (each logical processor's busy share as the hypervisor sees it, the actual frequency, power and thermal limits) are read every second meanwhile. It writesresults/envcheck/<time>-contention.json. WithBENCH_HOST=onthe benchmark designs take their host machine from it (architecture.host, engine 0.16.0); by default they have none, as before (see What the machine itself does).contention --service-onlytakes only the machine at rest and the service at three rates (about 4 minutes).
report --json also writes the same numbers as data, to docs/validation/accuracy.json and a
copy in apps/web/src/data/ (the web image is built from apps/web alone; a test keeps the two
equal). The web app's public /accuracy page is built from that copy.
A GitHub Actions workflow (.github/workflows/benchmark.yml) runs everything on a hosted runner
every week, on every release tag (v*) and by hand: it archives the previous results, measures,
runs report --json, uploads the raw results as an artifact and opens a pull request for a
person to review and merge. Each run takes a hosted runner about 1.5 hours; the weekly and
release-tag triggers sit in a marked block at the top of the workflow, commented out until a run
started by hand passes on Linux. It has not completed a run yet: two manual
runs stopped before measuring (the second asked for more CPUs than the hosted runner's 2; the
workflow now shares the runner's own CPUs between the containers). Every measured run so far was
on Windows with Docker Desktop; on Linux, the local runs have not been tried (the k6 container
writes its summary as uid 12345, so the runner makes benchmarks/results/.k6 world-writable for
it, untested on Linux).
Protocol#
Each experiment (the harness, archsim-benchmarks) runs on a fresh stack (benchmarks/compose.yaml): a small
Node.js service (benchmarks/service/server.js, no framework), PostgreSQL 16, Redis 7 and Kafka
3.8 as each experiment needs, and k6 as the open-loop load generator (constant arrival rate,
like ArchSim's clients). Every container is pinned to its own CPUs.
-
Settle (protocol v4): after the data load,
VACUUM ANALYZEand a checkpoint, then a discarded 30 s warm-up at the calibration rate, so autovacuum and cold caches do not land in a calibration pass. -
Calibrate (protocol v6, since W26; the kept runs ran v5): 20 s at rest, which gives each container's idle CPU, then a staircase of the experiment's traffic: 50 req/s, then each pass at 65% of the service's core at the CPU per request the pass before measured, but at most half of any other capacity that pass implies (the connection pool, the hot row's lock, the Kafka consumers: those bounds come from times that include the network and driver, and past them a backlog would carry into the next pass); no higher once a pass's p95 passes 10 ms, and no rise of less than 10% (at most five rises). Because each step uses the cost the pass before measured, and that cost still falls, the climb ends at about 60% to 65% of the core. 65% is the most the in-sample stacks took with p95 still a few milliseconds: the kept runs' ladders put the service at 1.4 to 2.2 ms around half a core and pg-mixed at 8 to 11 ms by three quarters. Protocol v5 stopped at 35% of the core (each pass at half the capacity the one before implied, at most three rises of at least 25%), about a third of the knee, so the inputs and
cpuByLoaddescribed a third of the load range. The staircase then comes down again and the top rate runs once more: every rate twice, the top three times, so drift on the machine shows.calibration.jsonrecords the settings (staircaseRule). The service records its CPU per request (Node's process CPU, including garbage collection and driver work), its own time per request (handler minus awaited calls) and the time of every PostgreSQL, Redis and Kafka call; the runner reads PostgreSQL's and Redis's own CPU and command time and, since W24 (after every kept run), each container's working set at rest and in every pass (ResourceSampler, every 5 s). Since engine 0.15.0 it also reads PostgreSQL's own statistics over each pass (compose.yamlloadspg_stat_statementsand setstrack_wal_io_timing): each statement's time inside the server, the WAL flushes with their time and the commits that shared one, the time backends were active, and the CPU of the backends and of the background processes (calibration.json,postgresin each pass). From those, a query's time in PostgreSQL is its CPU per query, the rest of the round trip the service measured (its driver and the network) is the link to the database, and a WAL flush takes what PostgreSQL measured; runs without the statistics fit the flush in the model to the wait the service measured (the harness'sDatabaseInputs, W22). Each top pass, with the auxiliary mixes run right after it, gives one replicate set of model inputs: CPU per request is the pass's CPU net of what the process burns at rest, timings come from the pass, and the one input not measured directly (the client-to-service latency) is set so the model reproduces the pass's median. Before that, the service time's spread is checked the same way (W29, after the v6 campaign; the harness'sAnchoring): its shape (p95 over median) comes from the handler's own time, which is under a tenth of the CPU per request, and where replies come back in batches (Redis's) it holds the wait behind the requests resolved ahead of it, which the model then simulates again: cache-aside's spread 11 to 13 times from median to p95, against 2 to 3 for the others. When the model's p95 - p50 at the pass is wider than k6's, the spread narrows, keeping the mean, until they match; it is never widened, since a tail the model misses can be the database's, the broker's or the network's. Redis's command time is its container's CPU per command, net of idle (W24; before,INFO commandstats' own time, which leaves out its network reads and writes), and each service's memory at idle and per req/s is fitted to its working set over the staircase (W24; calibrations without the readings keep ArchSim's defaults). The inputs are the replicates' medians;cpuByLoadkeeps every rate's CPU per request, which since W21 (engine 0.15.0) becomes the service'sserviceTimeByLoad, relative to the top rate and kept at the top rate's cost above it. W26 added a way to carry a measured fall above the top (extend_load_curve, the harness'sCurveForm.LOG): fitted over every pass at the rates that kept the core at least 30% busy, used only when the top kept it at least 45% busy and the fall is more than twice its standard error, continued linearly in log(rate) at most as far above the top as those rates span below it, and never past where the core fills. It is off by default (CurveForm.FLAT): it was checked only on staircases built from the kept runs' measured ladders, not on a v6 calibration (see "What would make it better next"). Since W21 the Node.js service also reports V8's garbage collections: its mark-compact cycles in the top pass become the model's GC pauses (gcPauseMs,gcEveryRequests), and their time comes off the CPU per request, which already held it; the frequent short scavenges stay in the CPU per request. A pass whose p95 is more than 10 times its median was disturbed: it is recorded, discarded and run again. Each input is derived by a formula recorded next to it incalibration.json. Protocol v4 (runs up to 6) calibrated in two passes, 50 req/s and a quarter of the pessimistic capacity, and took CPU per request as the slope between them; the machine check above shows why that read the cost too high. -
Predict: the runner builds the ArchSim design (one Node.js event loop on 1 vCPU, a pool of 10 database connections, PostgreSQL on 2 vCPU, and so on), searches the knee, and simulates every step of the ladder: 0.25, 0.5, 0.75, 0.9, 1.0, 1.1, 1.25 and 1.5 times the predicted knee. Since W28 (1 Nov 2026) it also predicts an 80% range for the knee: the measured knee should fall inside it in about four runs of five. The range is a lognormal around the predicted knee whose spread adds two parts, both fitted on the four in-sample experiments only (
benchmarks/knee-range.json, written byrange-fit; the fit and its check:docs/validation/knee-range.md):- What a fresh calibration on another day would give. The inputs move between calibrations of the same stack: the service's CPU per request by about 17% (one standard deviation; 13% to 14% for three experiments, 24% for hot-row), a query's time in PostgreSQL by about 18%, the WAL flush by 9%, Redis's command time and Kafka's publish by about 11% (over 25 v5 calibrations: the 14 kept runs and 11 calibration-only trials, all on the same machine, OS build and power mode). Within one calibration the three replicate sets agree more closely (the service's CPU per request to about 5%). Much of the CPU's variation is where the staircase stopped, since the cost per request falls with load: pg-mixed's trial that topped at 1,024 req/s read 0.29 ms, the one that topped at 1,931 read 0.20 ms. The same holds for the WAL flush: hot-row's staircase topped at 221 req/s in run 6 and at 381 in run 7, its flush read 1.01 and 0.74 ms, and its predicted knee moved from 744 to 1,062 req/s. The runner reads how much the knee moves with each input (a knee search with the input 22% higher, against one without, both on 10 s simulations) and multiplies, so a knee set by a noisier input gets a wider range: pg-mixed's, cache-aside's and Kafka's knees fall 1% for each 1% of the service's CPU, which gives them a calibration spread of 0.17 (log standard deviation, about ±17%); hot-row's is set by the flush (-0.8) and the write's time (-0.26), 0.10.
- The model's own error. The measured knee was further from the prediction than the calibration explains, and on the same side in every run of an experiment (pg-mixed's 17% to 20% below the prediction, cache-aside's 35% to 51% above): a log standard deviation of 0.15, fitted by maximum likelihood over the 12 counted v5 runs. The two parts are about the same size; together they make the 80% range about x0.75 to x1.33 of the predicted knee.
Engine 0.14.0's runs took the range from the three replicate sets' knees, the lowest to the highest (nominally 50%: (R - 1) / (R + 1)); it held the measured knee in 1 of 12 runs, because it carried neither part. Checked on the same 12 runs with today's engine, the new 80% range holds 9 of 12 in-sample, 9 when the run checked is left out of the fit and 9 when its whole experiment is (at 50% and 90% nominal: 5 and 10 of 12). The three misses are cache-aside's, whose knee the model puts too low in every run. Two runs sit within 1% of an end (Kafka's run 3 inside, cache-aside's run 3 outside), and 12 runs of four experiments are a weak check: these are runs the model was tuned on, and the held-out campaign is the test on data the range was not fitted to.
predictions.jsonis written before the first measured step, with its provenance: the commit, the engine's and the harness's git object ids, whether either had uncommitted changes, and the machine. Its sha256 goes to the log and intomeasured.jsonbefore the first step is measured. When the system still meets the objective at the top of the ladder, the runner climbs by 30% (at most four times), predicting, saving and sealing each new step before measuring it. -
Measure each step three times: 5 s of warm-up, then 20 s measured, 2 s client timeout; each metric is the median of the three (robust to one stall), and a step whose three p95s differ by more than 2x across the objective is marked unstable. p50, p95 and p99 are over successful requests started in the window, as in ArchSim's reports; requests k6 could not send in time count as failures. A repeat in which k6 sent nothing (the load generator failed) is recorded, discarded and run again. A repeat in which requests were sent and none succeeded is a failed repeat: it has no latency, and in the step's medians it counts as slower than any measured repeat (run 4 recorded two such repeats as 0 ms; the comparison now treats them as failed). Since run 5, the runner also waits (at most 60 s) between repeats until the service answers its health check and PostgreSQL has no query left running (except on the Kafka stack, which already waits for its backlog to drain), and each repeat reads every container's CPU and memory (cgroup v2: CPU time and working set) every 5 s inside the measured window (run 4 recorded CPU over the whole k6 command, see Resources).
-
Compare step by step (
comparison.json), the knee, and each part's CPU and memory against the model's. A run whose ladder misses the objective at one step and meets it at a higher one was disturbed: a stable stack does not get faster with more load, and the knee is set by the first miss, so that knee is not the stack's. Such a run is kept and listed, but the report leaves it out of the criteria, the repeatability and the run-to-run spread. This rule was added on 31 Oct 2026, after the baseline campaign's first two pg-mixed runs: at 2,112 and 2,550 req/s two of three repeats stalled, with every container's CPU per request rising 2 to 3 times at once while none was more than half busy, and the same runs then met the objective at 3,169 and 5,100 req/s. It flags no other run under v5, and six of the 14 earlier runs.
Nothing measured at steps 4 and 5 feeds back into the model: the predictions use only the calibration passes.
Protocol history#
Earlier runs are kept in benchmarks/results/<experiment>/run-N/ (cache-aside and Kafka were
first run in run 4, which their run-1/ folders hold). The protocol changed between runs, each
time after a run exposed a flaw in the calibration. Every change was made with earlier results
in view (the PostgreSQL experiments' for v2 to v4, all four's for v5 and v6), so all four
experiments are in-sample for the current protocol (v6, first run in the v6 campaign of 1-2
Nov):
| Run | Protocol | What it showed |
|---|---|---|
| 1 | one pass at 50 req/s, CPU per request as measured | At 50 req/s a laptop's cores sit in low-power states, so CPU per request came out about 4x what it costs under load. |
| 2 | two passes, CPU per request from the slope (v2) | Fixed CPU cancels out; but the database driver's CPU was counted twice (in the CPU per request and inside the measured query time), so the model started about 2x too slow. Measured steps overlapped with other work on the machine. |
| 3 | v2 plus the anchor at the calibration rate (v3) | pg-mixed's first pass met the post-load autovacuum (p95 280 ms at 50 req/s), which inflated CPU per request 3x and sent every input wrong; hot-row's single-row lock turned short host stalls (package installs and test runs in other work) into seconds-long queues. Neither run measured the model. |
| 4 | v3 plus settling and disturbed-pass retries (v4), machine otherwise idle | The first clean runs of pg-hot-row, cache-aside and Kafka. |
| 5 | v4; CPU and memory read inside the measured window; engine 0.13.0 | pg-mixed: knee 2,430 req/s against 2,238 predicted (-8%). The run of the other three was discarded: other work on the machine (video rendering) took its memory, so pg-hot-row's calibration measured a commit-flush p95 of 417 ms and Docker stalled for 20 minutes during cache-aside; Kafka did not run. They were run again in run 6. |
| 6 | v4, as run 5, after a Windows update (build 26300, with a new WSL kernel) | pg-hot-row, cache-aside and Kafka, on an otherwise idle machine (no discarded pass; commit-flush p95 1.8 ms). The update made the stacks faster: Kafka's publish p95 in calibration fell from 10.1 to 2.6 ms and its knee rose from 945 to 2,040 req/s; hot-row held 777 req/s, where run 4 stalled at 333. |
| 7 | v5 (a staircase with replicate sets and a predicted range; CPU per request net of idle at the top rate), engine 0.14.0, Windows on Best performance, k6 off the service's hyperthread sibling; three runs of each experiment, rotating (the baseline campaign, 30-31 Oct) | Engine 0.14.0's numbers, the first ones on /accuracy. The stacks were faster again under Best performance: pg-mixed's knee about 4,000 req/s, cache-aside's about 7,000. pg-mixed's first two runs (22:30 to 01:05, Western European time) were disturbed, cause unknown (Windows logged no throttling, Defender scan or other event around the first stall): two of three repeats stalled at 2,112 req/s in one, and the other missed at 2,550 to 4,590 req/s and met the objective at 5,100. Both are kept and not counted, and pg-mixed ran twice more on the idle machine (run-9/ and the latest). Calibration retried five disturbed passes, all between 00:29 and 01:08. |
| 8 | v6 (the staircase climbs to about two thirds of the service's core, W26), engine 0.16.0 with the 80% predicted range (W28), Kafka's broker healthcheck run once (W23), same machine, OS build and power mode; three runs of each experiment, rotating (the v6 campaign, 1-2 Nov) | The tuned-on experiments' first three runs under engine 0.16.0. No run was disturbed; calibration retried four disturbed passes, all pg-mixed's (23:47 to 23:52 and 04:05 to 04:13). The staircases topped at 2,373 to 3,155 req/s for pg-mixed, 357 to 374 for hot-row, 3,023 to 3,350 for cache-aside and 971 to 1,015 for Kafka. The measured knees: pg-mixed 4,237 to 4,495 req/s (v5: 3,783 to 4,160), hot-row 939 to 953, cache-aside 6,702 to 7,010, and Kafka 2,614 to 2,802 without the healthcheck (v5: 2,028 to 2,132 with it). |
| 9 | v6 and engine 0.16.0, unchanged: the held-out campaign (3-4 Nov, the five held-out experiments three times each, rotating) and a repeat of the four tuned-on ones (4 Nov, three runs each, rotating) | The held-out numbers in the headline, none of them disturbed. In the repeat, hot-row's and Kafka's first runs were disturbed and are not counted, and pg-mixed's first, the first experiment after Docker Desktop had been restarted, measured 2,875 req/s against 4,371 and 4,483 in the other two: counted, though its repeats swung as in no other run. |
Protocol v6 (W26, 1 Nov 2026; first run in the v6 campaign, run 8) climbs the staircase to
about two thirds of the service's core instead of a third (step 2), because every v5 staircase stopped at a third
of the knee and read the CPU per request where it was still falling: cache-aside's real cost fell
from 0.21 ms at the v5 top to 0.13 ms near the knee. Replaying v6's rise rule on each counted
run's own costs (its staircase, then its measured ladder) puts the climb's top at 3,000 to
3,500 req/s for pg-mixed and cache-aside (60% to 65% of the core) and about 870 req/s for Kafka
(held by half the consumers' capacity); the core would then fill, at the top's cost, 20% below
cache-aside's measured knee (median; was 33%), 20% above pg-mixed's (was 24%) and 12% above
Kafka's (was 4%; Kafka's measured knees are the old healthcheck's). These are estimates from
data the protocol was designed with, not measurements. The first v6 trial, on 1 Nov, ran on a
throttled laptop (busy cores at 74% to 92% of the base clock, every CPU cost about twice its
usual) and was stopped; the trial script now waits for a boosting CPU
(benchmarks/results/trials/W26-trial.py). In the campaign itself the climb topped where the
estimate put it for cache-aside (3,023 to 3,350 req/s) and Kafka (971 to 1,015), lower for
pg-mixed in two of three runs (2,453 and 2,502; the third reached 3,155), and the predicted knees
landed 25% below cache-aside's measured knee (median), 11% above pg-mixed's and 3% below
Kafka's.
Every kept run, compared the same way (compare):
| Experiment | Results | Protocol | Calibrated (UTC) | Knee measured | Knee predicted | Knee error | Counted |
|---|---|---|---|---|---|---|---|
| java-mixed | run-1/ |
v6 | 2026-11-03T21:34:40Z | 4,198 req/s | 7,915 req/s | +89% | yes |
| java-mixed | run-2/ |
v6 | 2026-11-04T00:33:23Z | 4,799 req/s | 7,857 req/s | +64% | yes |
| java-mixed | latest (results/java-mixed/) |
v6 | 2026-11-04T03:38:18Z | 4,650 req/s | 7,907 req/s | +70% | yes |
| go-mixed | run-1/ |
v6 | 2026-11-03T22:16:39Z | 5,508 req/s | 9,517 req/s | +73% | yes |
| go-mixed | run-2/ |
v6 | 2026-11-04T01:13:30Z | 6,204 req/s | 9,802 req/s | +58% | yes |
| go-mixed | latest (results/go-mixed/) |
v6 | 2026-11-04T04:19:22Z | 5,950 req/s | 9,916 req/s | +67% | yes |
| python-mixed | run-1/ |
v6 | 2026-11-03T22:58:02Z | 1,428 req/s | 1,850 req/s | +30% | yes |
| python-mixed | run-2/ |
v6 | 2026-11-04T01:55:30Z | 1,385 req/s | 1,788 req/s | +29% | yes |
| python-mixed | latest (results/python-mixed/) |
v6 | 2026-11-04T05:00:48Z | 1,388 req/s | 1,762 req/s | +27% | yes |
| chain | run-1/ |
v6 | 2026-11-03T23:27:46Z | 3,503 req/s | 4,353 req/s | +24% | yes |
| chain | run-2/ |
v6 | 2026-11-04T02:28:58Z | 3,475 req/s | 4,531 req/s | +30% | yes |
| chain | latest (results/chain/) |
v6 | 2026-11-04T05:34:15Z | 3,388 req/s | 4,455 req/s | +32% | yes |
| cache-ttl | run-1/ |
v6 | 2026-11-04T00:02:42Z | 5,747 req/s | 5,303 req/s | -8% | yes |
| cache-ttl | run-2/ |
v6 | 2026-11-04T03:05:38Z | 5,336 req/s | 5,401 req/s | +1% | yes |
| cache-ttl | latest (results/cache-ttl/) |
v6 | 2026-11-04T06:11:13Z | 5,420 req/s | 5,104 req/s | -6% | yes |
| pg-mixed | run-1/ |
v1 | 2026-10-26T08:00:55Z | > 1,359 req/s | 906 req/s | - | yes |
| pg-mixed | run-2/ |
v2 | 2026-10-26T08:23:18Z | 1,895 req/s | 2,314 req/s | +22% | no: missed at 2,081 req/s, met higher |
| pg-mixed | run-3/ |
v3 | 2026-10-26T09:46:26Z | 3,162 req/s | 808 req/s | -74% | yes |
| pg-mixed | run-4/ |
v4 | 2026-10-26T11:13:41Z | 2,291 req/s | 2,064 req/s | -10% | yes |
| pg-mixed | run-5/ |
v4 | 2026-10-28T23:21:36Z | 2,430 req/s | 2,238 req/s | -8% | yes |
| pg-mixed | run-6/ |
v5 | 2026-10-30T21:30:44Z | 1,089 req/s | 4,230 req/s | +288% | no: missed at 2,112 req/s, met higher |
| pg-mixed | run-7/ |
v5 | 2026-10-30T23:44:23Z | 1,449 req/s | 5,108 req/s | +253% | no: missed at 2,550, 3,825 and 4,590 req/s, met higher |
| pg-mixed | run-8/ |
v5 | 2026-10-31T01:52:33Z | 4,160 req/s | 5,003 req/s | +20% | yes |
| pg-mixed | run-9/ |
v5 | 2026-10-31T04:02:33Z | 3,783 req/s | 4,729 req/s | +25% | yes |
| pg-mixed | run-10/ |
v5 | 2026-10-31T04:34:12Z | 4,006 req/s | 4,956 req/s | +24% | yes |
| pg-mixed | run-11/ |
v6 | 2026-11-01T22:53:59Z | 4,495 req/s | 4,780 req/s | +6% | yes |
| pg-mixed | run-12/ |
v6 | 2026-11-02T01:02:03Z | 4,364 req/s | 4,856 req/s | +11% | yes |
| pg-mixed | run-13/ |
v6 | 2026-11-02T03:15:28Z | 4,237 req/s | 5,055 req/s | +19% | yes |
| pg-mixed | run-14/ |
v6 | 2026-11-04T07:15:57Z | 2,875 req/s | 5,406 req/s | +88% | yes |
| pg-mixed | run-15/ |
v6 | 2026-11-04T09:35:52Z | 4,371 req/s | 5,059 req/s | +16% | yes |
| pg-mixed | latest (results/pg-mixed/) |
v6 | 2026-11-04T11:52:16Z | 4,483 req/s | 5,203 req/s | +16% | yes |
| pg-hot-row | run-1/ |
v1 | 2026-10-26T08:11:06Z | 303 req/s | 403 req/s | +33% | no: missed at 363 and 443 req/s, met higher |
| pg-hot-row | run-2/ |
v2 | 2026-10-26T08:42:10Z | 819 req/s | 418 req/s | -49% | yes |
| pg-hot-row | run-3/ |
v3 | 2026-10-26T10:11:09Z | 132 req/s | 504 req/s | +281% | no: missed at 252 and 553 req/s, met higher |
| pg-hot-row | run-4/ |
v4 | 2026-10-26T11:33:38Z | 225 req/s | 444 req/s | +97% | no: missed at 333 req/s, met higher |
| pg-hot-row | run-5/ |
v4 | 2026-10-30T10:32:56Z | 814 req/s | 519 req/s | -36% | yes |
| pg-hot-row | run-6/ |
v5 | 2026-10-30T21:58:50Z | 819 req/s | 663 req/s | -19% | yes |
| pg-hot-row | run-7/ |
v5 | 2026-10-31T00:14:43Z | 960 req/s | 958 req/s | 0% | yes |
| pg-hot-row | run-8/ |
v5 | 2026-10-31T02:21:39Z | 926 req/s | 783 req/s | -16% | yes |
| pg-hot-row | run-9/ |
v6 | 2026-11-01T23:24:56Z | 953 req/s | 862 req/s | -10% | yes |
| pg-hot-row | run-10/ |
v6 | 2026-11-02T01:33:51Z | 939 req/s | 851 req/s | -9% | yes |
| pg-hot-row | run-11/ |
v6 | 2026-11-02T03:46:41Z | 942 req/s | 851 req/s | -10% | yes |
| pg-hot-row | run-12/ |
v6 | 2026-11-04T07:49:19Z | 697 req/s | 826 req/s | +19% | no: missed at 742 and 825 req/s, met higher |
| pg-hot-row | run-13/ |
v6 | 2026-11-04T10:07:36Z | 947 req/s | 863 req/s | -9% | yes |
| pg-hot-row | latest (results/pg-hot-row/) |
v6 | 2026-11-04T12:24:30Z | 947 req/s | 857 req/s | -10% | yes |
| cache-aside | run-1/ |
v4 | 2026-10-26T11:53:13Z | 4,016 req/s | 3,457 req/s | -14% | no: missed at 4,312 req/s, met higher |
| cache-aside | run-2/ |
v4 | 2026-10-30T10:50:27Z | 4,848 req/s | 2,352 req/s | -51% | yes |
| cache-aside | run-3/ |
v5 | 2026-10-30T22:22:04Z | 7,138 req/s | 5,303 req/s | -26% | yes |
| cache-aside | run-4/ |
v5 | 2026-10-31T00:38:29Z | 6,432 req/s | 4,227 req/s | -34% | yes |
| cache-aside | run-5/ |
v5 | 2026-10-31T02:44:32Z | 7,324 req/s | 4,851 req/s | -34% | yes |
| cache-aside | run-6/ |
v6 | 2026-11-01T23:49:28Z | 6,702 req/s | 4,925 req/s | -27% | yes |
| cache-aside | run-7/ |
v6 | 2026-11-02T01:58:24Z | 7,010 req/s | 5,302 req/s | -24% | yes |
| cache-aside | run-8/ |
v6 | 2026-11-02T04:11:08Z | 6,918 req/s | 5,201 req/s | -25% | yes |
| cache-aside | run-9/ |
v6 | 2026-11-04T08:18:36Z | 6,086 req/s | 6,007 req/s | -1% | yes |
| cache-aside | run-10/ |
v6 | 2026-11-04T10:33:51Z | 6,874 req/s | 5,452 req/s | -21% | yes |
| cache-aside | latest (results/cache-aside/) |
v6 | 2026-11-04T12:50:54Z | 6,752 req/s | 5,652 req/s | -16% | yes |
| kafka | run-1/ |
v4 | 2026-10-26T12:22:50Z | 945 req/s | 1,006 req/s | +6% | no: missed at 1,006 req/s, met higher |
| kafka | run-2/ |
v4 | 2026-10-30T11:20:01Z | 2,040 req/s | 1,602 req/s | -21% | yes |
| kafka | run-3/ |
v5 | 2026-10-30T23:00:02Z | 2,132 req/s | 2,829 req/s | +33% | yes |
| kafka | run-4/ |
v5 | 2026-10-31T01:19:14Z | 2,087 req/s | 2,140 req/s | +3% | yes |
| kafka | run-5/ |
v5 | 2026-10-31T03:26:27Z | 2,028 req/s | 2,102 req/s | +4% | yes |
| kafka | run-6/ |
v6 | 2026-11-02T00:26:56Z | 2,614 req/s | 2,551 req/s | -2% | yes |
| kafka | run-7/ |
v6 | 2026-11-02T02:36:13Z | 2,659 req/s | 2,578 req/s | -3% | yes |
| kafka | run-8/ |
v6 | 2026-11-02T04:48:49Z | 2,802 req/s | 2,528 req/s | -10% | yes |
| kafka | run-9/ |
v6 | 2026-11-04T08:59:13Z | 2,266 req/s | 2,677 req/s | +18% | no: missed at 2,408 req/s, met higher |
| kafka | run-10/ |
v6 | 2026-11-04T11:12:22Z | 2,487 req/s | 2,728 req/s | +10% | yes |
| kafka | latest (results/kafka/) |
v6 | 2026-11-04T13:27:44Z | 2,387 req/s | 2,090 req/s | -12% | yes |
The measured knee moved between runs too, not only the prediction. Each step was measured the
same way in runs 2 to 7 (three repeats with a 20 s measured window), but in runs 2 and 3 the
machine was doing other work and the database was not settled first, run 6 came after a Windows
update and run 7 ran under Best performance. The run-to-run spread quoted here and on
/accuracy counts only the counted runs on the latest run's OS build and power mode.
Environment#
- CPU: 11th Gen Intel(R) Core(TM) i7-1165G7 @ 2.80GHz; Docker 29.1.3 (linux/amd64) with 8 CPUs and 7.6 GiB; Windows-11-10.0.26300-SP0 (Best performance).
- Images: postgres
postgres:16-alpine, redisredis:7-alpine, kafkaapache/kafka:3.8.0, k6grafana/k6:1.3.0, serviceeclipse-temurin:21-jre-alpine + Spring Boot 3.5.7 (Tomcat, HikariCP), G1, 1 GiB heap. - CPUs pinned per container (cpuset; k6 gets the CPUs the stack leaves free): java-mixed: service 2 (
2,3), PostgreSQL 2 (4,5), k6 4 (0,1,6,7); go-mixed: service 2 (2,3), PostgreSQL 2 (4,5), k6 4 (0,1,6,7); python-mixed: service 2 (2,3), PostgreSQL 2 (4,5), k6 4 (0,1,6,7); chain: gateway 1 (0), API 1 (2), PostgreSQL 2 (4,5), k6 2 (6,7); cache-ttl: service 1 (2), PostgreSQL 2 (4,5), Redis 1 (0), k6 2 (6,7); pg-mixed and pg-hot-row: service 1 (2), PostgreSQL 2 (4,5), k6 4 (0,1,6,7); cache-aside: service 1 (2), PostgreSQL 2 (4,5), Redis 1 (1), k6 3 (0,6,7); kafka: producer 1 (2), consumer 1 (3), PostgreSQL 2 (4,5), Kafka 2 (0,1), k6 2 (6,7).
What the machine itself does (envcheck, 30 Oct, Windows build 26300, pg-mixed's
workload, results/envcheck/):
- CPU per request falls steeply with the rate, in every container. The Node.js service used 0.96 ms per request at 50 req/s, 0.42 at 200, 0.29 at 400 and 0.21 to 0.22 from 800 to 1,600; PostgreSQL 0.93, 0.33, 0.21 and 0.19 ms. The cost settles only from about 800 req/s. The calibration passes (50 req/s and a quarter of the pessimistic capacity, a few hundred req/s) sit where it is highest and still changing, which is why protocol v4's CPU per request was about twice the real one near the knee. It looks like the host (cores idling into power-saving states at light load) rather than the application. Protocol v5 reads the cost at the top of a staircase instead, and under Best performance (run 7) the service's predicted CPU came within 4% to 34% of the measured one (see Resources).
- k6 on the service's hyperthread sibling (CPUs 2 and 3 are one physical core in Docker's
VM) cost the service 10% to 15% more CPU per request and raised p95 at 1,600 req/s from 1.4 to
2.2 ms. Since run 7 the runner leaves that sibling idle (k6 on
0,1,6,7for the PostgreSQL stack and0,6,7for the cache stack). PostgreSQL's two CPUs (4,5) are one physical core too, though the model gives it two cores; its CPU never came close to binding. - No CPU steal in Docker's VM, and no p95 near Windows' 15.6 ms timer tick at these rates.
- Every container shares the laptop's four physical cores, whatever its cpuset says
(
contention, 1 Nov,results/envcheck/2026-11-01T00-48-59Z-contention.json). Docker's VM numbers its CPUs as hyperthread pairs (2 and 3, 4 and 5, ...), but Windows schedules the VM's CPUs itself: a fixed unit of V8 work on CPU 2 with CPU 3 busy did 1.57 to 1.70 times one CPU's work together, where two threads of one core do about 1.2. What sets how fast CPU work runs is how many of the laptop's 8 logical processors are busy, in the VM or in Windows: the probe's CPU per unit of work was 0.85 to 1.0 times its cost with 1.8 to 3.5 of them busy, 1.2 times with 4.6, 1.5 with 5.5, 1.9 with 6.6, 2.1 with 7.4 and about 3 with all 8 busy (more work than processors). The clock fell in a straight line from 4,050 MHz with one busy to about 2,950 with eight, with no power or thermal limit flagged. Four physical cores, that clock (x0.73) and a thread sharing its core at 0.48 of its speed reproduce the probe's 20 conditions below full load within 5.5% (rms, in log). A container's CPU time includes the time Windows takes its processor away (the VM reports no steal), so a container's CPU per request rises with the whole machine's load, not only its own. After about 15 minutes near full load (this check and other work) the laptop's clock fell to about 1,600 MHz and stayed low for a while, again with no limit flagged: runs need the machine cool as well as idle.
Held-out experiments#
The four experiments after these (pg-mixed, pg-hot-row, cache-aside and Kafka) are in-sample:
the model and the calibration protocol were revised with their results in view. Five more were
registered on 30 Oct 2026 in commit ce2d109 (benchmarks/run.py, Experiment.held_out) to
test ArchSim on stacks it was never tuned on. They were sealed until an engine frozen in
benchmarks/engines.json had predicted them. Engine 0.16.0 was frozen for them on 2 Nov 2026
(tag engine-0.16.0; ADR 0017), and each was
measured three times on 3-4 Nov 2026, the three runs rotating through the five stacks. The
results, misses included, lead the headline:
- The harness refuses to calibrate or measure one unless the engine is one frozen in
benchmarks/engines.jsonand nothing in the engine or the harness is uncommitted. Its predictions are then saved before the first measured step, as for every experiment, so no model change can be tuned on its results first. Engine 0.16.0 was known by its source tree (git rev-parse HEAD:packages/engine); since stage 5 of the Java port deleted it, the harness runs the Java engine only, which keeps them sealed until its freeze says what identifies it (ADR-0062). - Before the freeze,
smoke <experiment>was the only way to start their stacks: 20 req/s for 10 s, checking that every request succeeded and that the services counted it. It keeps no latency and no results. - The report labels each pair of engine and experiment
held-outortuned-on. An experiment is held out for a frozen engine that does not list it intunedOn. The held-out experiments lead this page's tables, and an engine tuned on them later must list them intunedOn. - Changed after registration, before any measurement (31 Oct 2026): two library updates to
clear GitHub's dependency alerts. go-mixed's PostgreSQL driver pgx went from 5.7.6 to 5.9.2,
which also drops
golang.org/x/crypto, and python-mixed's Flask from 3.1.2 to 3.1.3. None of the flagged code could be reached (the SSH packages were never compiled in, the pgx bug is on the server side of the protocol, and the service does not use Flask's sessions). No held-out experiment had been calibrated or measured, so no result depends on the old versions.
| Experiment | What it tests | Stack |
|---|---|---|
| java-mixed | The java profile: a thread pool that waits on its own database calls, and stop-the-world GC |
Spring Boot 3.5 (Tomcat's 200 threads, HikariCP), Java 21 with G1 |
| go-mixed | The go profile: a goroutine per request, short GC pauses |
net/http and a pgx pool, GOMAXPROCS 2 |
| python-mixed | The python profile: worker processes that serve one request each |
Flask on gunicorn, 10 sync workers with a pool of 1 connection each |
| chain | Two services called one after the other | Node.js gateway (keep-alive) → Node.js API → PostgreSQL |
| cache-ttl | A TTL cache whose hit ratio rises with load, scored at every step | Node.js, Redis with a 5 s TTL, PostgreSQL; Zipf 1.1 over 1,000,000 keys |
Otherwise each uses pg-mixed's setup: 90% reads and 10% writes over 100,000 rows, a pool of 10 connections and PostgreSQL 16 on CPUs 4,5.
- CPUs. The three runtimes run on CPUs 2,3, which are the two hyperthreads of one physical core on the laptop. The model gives them 2 cores, a gap noted before they were measured; all three over-predict their knees (+29% to +70%), and how much of that this gap explains is not checked yet. chain's gateway and API get one CPU each (0 and 2), as does cache-ttl's Redis (0). No container shares a physical core with k6 or with another container. The cost: chain and cache-ttl leave CPUs 1 and 3 idle and give k6 one core (6,7), so their ladders need watching for dropped iterations.
- Service statistics. Every service exposes the same
/statsas the Node.js one: CPU per request, own time, call timings and garbage collection.- gunicorn's workers add theirs up in shared memory and take CPU from the container's cgroup.
- Java's and Go's GC pauses are calibrated from the runtime's own counters.
- Python's GC stays in the CPU per request: a gunicorn worker's collection stalls only its own request, while a pause in the model would stall all ten.
- Fan-out. Parallel fan-out is not modelled, so
chaincalls one service after the other. - cache-ttl's skew is 1.1, not 0.8. With Zipf 0.8 over a million keys and a 5 s TTL, the hit ratio would be 9% to 24%. With 1.1 it rises from about 52% at 250 req/s to 69% at 4,000 req/s. k6 draws keys from a keyspace this large by rejection-inversion, which gives exactly the same distribution without a table in every VU.
java-mixed#
Spring Boot (Tomcat, HikariCP) + PostgreSQL: 90% reads, 10% writes over 100,000 rows. Calibrated 2026-11-04T03:38:18Z, predicted 2026-11-04T03:49:29Z (engine 0.16.0), measured afterwards. Objective: p95 <= 50 ms with >= 99% success.
Model inputs from a staircase of calibration passes at 50, 621, 2,826 and 3,553 req/s (each rate up and down again): the median of 3 replicate sets from the 3,553 req/s passes, CPU per request net of the 20 s at rest:
| Input | Value | How it was measured |
|---|---|---|
serviceTimeMs |
lognormal, median 0.2251 ms, p95 0.4991 ms | the median of 3 replicates (first): mean = the Spring Boot service's CPU per request at 3553 req/s net of idle: (27070 - 90 ms at rest) / 106592 requests = 0.2531 ms; shape (p95/median 0.1881/0.0848 ms) from the handler's own time |
clientLinkLatencyMs |
0.0242 ms | the median of 3 replicates (second): anchored: (measured median 0.516 ms - the model's median without it 0.468 ms at 3553 req/s) / 2, one way, at least 0 |
serviceTimeByLoad |
x5.46 at 50, x1.48 at 621, x1.00 at 2,826, x1.00 at 3,553 req/s | the median of 3 replicates (first): the staircase's CPU per request net of idle (1.3791 ms at 50, 0.3736 ms at 621, 0.2522 ms at 2826, 0.2531 ms at 3553 req/s), fitted never rising with rate and divided by the top rate's (0.2531 ms); flat outside the staircase |
gcPauseMs |
6.4221 ms | the median of 3 replicates (third): the runtime's stop-the-world pauses in the pass: 15.00 ms over 2 collections, a mean of 7.5000 ms (the model's median: mean / 1.17) |
gcEveryRequests |
53296 | the median of 3 replicates (first): 106592 requests / 2 collections in the pass |
writeServiceTimeMs |
lognormal, median 0.075 ms, p95 0.5793 ms | the median of 3 replicates (first): PostgreSQL's CPU per UPDATE with synchronous_commit off (0.1624 ms), shaped like its round trip (median 0.202, p95 1.562 ms) |
readServiceTimeMs |
lognormal, median 0.1204 ms, p95 0.3501 ms | the median of 3 replicates (second): PostgreSQL's CPU per SELECT (0.1486 ms, the pass's less its UPDATEs'), shaped like its round trip (median 0.186, p95 0.541 ms) |
dbLinkLatencyMs |
lognormal, median 0.0176 ms, p95 0.1619 ms | the median of 3 replicates (first): each way: the round trip the service measured less PostgreSQL's time, in two legs that keep its mean and variance (median 0.0176, p95 0.1619 ms) |
dbCpuShare |
1 | the median of 3 replicates (second): PostgreSQL CPU per query at the top pass net of idle (0.1497 ms) / the model's mean time per query (96088 reads at 0.149 ms and 10502 writes without their flush at 0.159 ms: 0.150 ms) |
commitFlushMs |
lognormal, median 1.0224 ms, p95 1.2929 ms | the median of 3 replicates (third): PostgreSQL's own WAL flushes at 3553 req/s (pg_stat_wal): 10149 flushes of 1.033 ms on average, 1.04 commits per flush (the model: 1.04); shaped like the commit wait the service measured (p95/median 1.26, mean 1.144 ms) |
serviceMemoryBaselineMb |
486.052 | the median of 3 replicates (first): at idle: the api-java container's working set (the highest reading in each pass) against req/s over 10 points (at rest and 9 passes, 50 to 3,553 req/s), by non-negative least squares: 486.1 MiB + 0.1094 MiB per req/s, largest error at and above the median rate 8% |
serviceMemoryPerRpsMb |
0.109395 | the median of 3 replicates (first): per req/s: the api-java container's working set (the highest reading in each pass) against req/s over 10 points (at rest and 9 passes, 50 to 3,553 req/s), by non-negative least squares: 486.1 MiB + 0.1094 MiB per req/s, largest error at and above the median rate 8% |
serviceMemoryPerRequestMb |
0.01 | the median of 3 replicates (first): per request held: the floor, since the fit against req/s explains the whole working set (held requests' memory would count twice otherwise) |
Measured in the calibration pass at 3,553 req/s: p50 0.53 ms, p95 2.39 ms.
| Offered req/s | p50 meas / pred (ms) | p95 meas / pred (ms) | p95 error | p99 meas / pred (ms) | Success meas / pred | Throughput meas / pred |
|---|---|---|---|---|---|---|
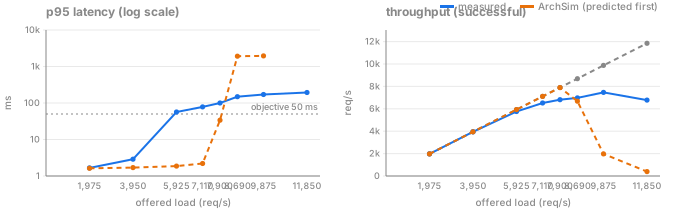
| 1,975 | 0.46 / 0.55 | 1.67 / 1.63 | -2% | 2.89 / 2.24 | 100% / 100% | 1,975 / 1,975 |
| 3,950 | 0.56 / 0.53 | 2.88 / 1.70 | -41% | 8.40 / 2.42 | 100% / 100% | 3,950 / 3,950 |
| 5,925 | 1.39 / 0.56 | 56.8 / 1.87 | -97% | 112 / 2.73 | 97% / 100% | 5,758 / 5,925 |
| 7,110 | 4.13 / 0.67 | 78.3 / 2.19 | -97% | 146 / 5.24 | 92% / 100% | 6,516 / 7,110 |
| 7,900 (unstable) | 17.8 / 17.9 | 99.7 / 33.7 | -66% | 169 / 37.2 | 86% / 100% | 6,811 / 7,892 |
| 8,690 | 47.6 / 1,239 | 149 / 1,916 | +1188% | 220 / 1,994 | 80% / 75% | 6,977 / 6,676 |
| 9,875 | 61.3 / 1,635 | 171 / 1,954 | +1044% | 244 / 1,994 | 70% / 15% | 7,462 / 1,974 |
| 11,850 | 76.1 / - | 194 / - | - | 274 / - | 57% / 0% | 6,778 / 394 |
Unstable: the step's repeats' p95s differ by more than 2x across the objective (a repeat with no successful request counts as slower than any).
Knee: measured 4,650 req/s, predicted 7,907 req/s on the same steps (+70%); ArchSim's own search before measuring put it at 7,900 req/s. Its predicted 80% range was 5,926 to 10,531 req/s: the measured knee fell outside it. Data: benchmarks/results/java-mixed/ (each repeat's numbers as extracted from k6's summary; the summaries themselves are not kept).
go-mixed#
Go (net/http, pgx) + PostgreSQL: 90% reads, 10% writes over 100,000 rows. Calibrated 2026-11-04T04:19:22Z, predicted 2026-11-04T04:33:11Z (engine 0.16.0), measured afterwards. Objective: p95 <= 50 ms with >= 99% success.
Model inputs from a staircase of calibration passes at 50, 1,551 and 4,132 req/s (each rate up and down again): the median of 3 replicate sets from the 4,132 req/s passes, CPU per request net of the 20 s at rest:
| Input | Value | How it was measured |
|---|---|---|
serviceTimeMs |
lognormal, median 0.1678 ms, p95 0.4533 ms | the median of 3 replicates (second): mean = the Go service's CPU per request at 4132 req/s net of idle: (24966 - 1 ms at rest) / 123961 requests = 0.2014 ms; shape (p95/median 0.0032/0.0012 ms) from the handler's own time |
clientLinkLatencyMs |
0.0131 ms | the median of 3 replicates (first): anchored: (measured median 0.459 ms - the model's median without it 0.432 ms at 4132 req/s) / 2, one way, at least 0 |
serviceTimeByLoad |
x3.80 at 50, x1.10 at 1,551, x1.00 at 4,132 req/s | the median of 3 replicates (first): the staircase's CPU per request net of idle (0.7660 ms at 50, 0.2216 ms at 1551, 0.2014 ms at 4132 req/s), fitted never rising with rate and divided by the top rate's (0.2014 ms); flat outside the staircase |
gcPauseMs |
0.1148 ms | the median of 3 replicates (third): the runtime's stop-the-world pauses in the pass: 12.47 ms over 93 collections, a mean of 0.1341 ms (the model's median: mean / 1.17) |
gcEveryRequests |
1333 | the median of 3 replicates (third): 123961 requests / 93 collections in the pass |
writeServiceTimeMs |
lognormal, median 0.0127 ms, p95 0.4979 ms | the median of 3 replicates (second): PostgreSQL's CPU per UPDATE with synchronous_commit off (0.1530 ms), shaped like its round trip (median 0.225, p95 8.870 ms) |
readServiceTimeMs |
lognormal, median 0.1091 ms, p95 0.2836 ms | the median of 3 replicates (third): PostgreSQL's CPU per SELECT (0.1292 ms, the pass's less its UPDATEs'), shaped like its round trip (median 0.200, p95 0.519 ms) |
dbLinkLatencyMs |
lognormal, median 0.0283 ms, p95 0.1936 ms | the median of 3 replicates (first): each way: the round trip the service measured less PostgreSQL's time, in two legs that keep its mean and variance (median 0.0283, p95 0.1936 ms) |
dbCpuShare |
1 | the median of 3 replicates (second): PostgreSQL CPU per query at the top pass net of idle (0.1340 ms) / the model's mean time per query (111557 reads at 0.132 ms and 12404 writes without their flush at 0.153 ms: 0.134 ms) |
commitFlushMs |
lognormal, median 0.9901 ms, p95 1 ms | the median of 3 replicates (second): PostgreSQL's own WAL flushes at 4132 req/s (pg_stat_wal): 11719 flushes of 0.990 ms on average, 1.06 commits per flush (the model: 1.06); shaped like the commit wait the service measured (p95/median 1.01, mean 1.077 ms) |
serviceMemoryBaselineMb |
17.064 | the median of 3 replicates (first): at idle: the api-go container's working set (the highest reading in each pass) against req/s over 8 points (at rest and 7 passes, 50 to 4,132 req/s), by non-negative least squares: 17.1 MiB + 0.0031 MiB per req/s, largest error at and above the median rate 18% |
serviceMemoryPerRpsMb |
0.003141 | the median of 3 replicates (first): per req/s: the api-go container's working set (the highest reading in each pass) against req/s over 8 points (at rest and 7 passes, 50 to 4,132 req/s), by non-negative least squares: 17.1 MiB + 0.0031 MiB per req/s, largest error at and above the median rate 18% |
serviceMemoryPerRequestMb |
0.01 | the median of 3 replicates (first): per request held: the floor, since the fit against req/s explains the whole working set (held requests' memory would count twice otherwise) |
Measured in the calibration pass at 4,132 req/s: p50 0.46 ms, p95 2.17 ms.
| Offered req/s | p50 meas / pred (ms) | p95 meas / pred (ms) | p95 error | p99 meas / pred (ms) | Success meas / pred | Throughput meas / pred |
|---|---|---|---|---|---|---|
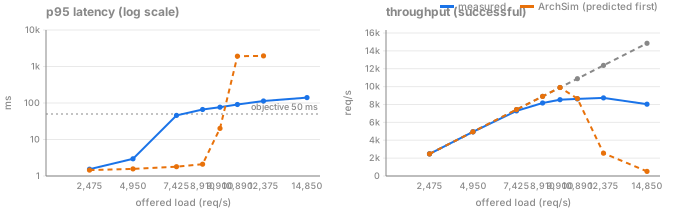
| 2,475 | 0.42 / 0.46 | 1.54 / 1.45 | -6% | 2.58 / 2.03 | 100% / 100% | 2,475 / 2,475 |
| 4,950 | 0.50 / 0.46 | 2.95 / 1.57 | -47% | 9.56 / 2.24 | 100% / 100% | 4,950 / 4,950 |
| 7,425 | 1.48 / 0.51 | 45.7 / 1.80 | -96% | 71.2 / 2.52 | 98% / 100% | 7,284 / 7,425 |
| 8,910 | 3.65 / 0.64 | 66.2 / 2.11 | -97% | 86.2 / 3.53 | 92% / 100% | 8,170 / 8,910 |
| 9,900 | 13.8 / 7.06 | 76.5 / 20.2 | -74% | 105 / 24.1 | 84% / 100% | 8,532 / 9,900 |
| 10,890 | 46.8 / 1,239 | 90.9 / 1,916 | +2007% | 118 / 1,994 | 79% / 77% | 8,629 / 8,660 |
| 12,375 | 71.3 / 1,603 | 114 / 1,954 | +1620% | 160 / 1,994 | 69% / 16% | 8,741 / 2,551 |
| 14,850 | 85.0 / - | 141 / - | - | 197 / - | 54% / 0% | 8,031 / 519 |
Knee: measured 5,950 req/s, predicted 9,916 req/s on the same steps (+67%); ArchSim's own search before measuring put it at 9,900 req/s. Its predicted 80% range was 7,426 to 13,199 req/s: the measured knee fell outside it. Data: benchmarks/results/go-mixed/ (each repeat's numbers as extracted from k6's summary; the summaries themselves are not kept).
python-mixed#
Flask on gunicorn (10 sync workers) + PostgreSQL: 90% reads, 10% writes over 100,000 rows. Calibrated 2026-11-04T05:00:48Z, predicted 2026-11-04T05:02:55Z (engine 0.16.0), measured afterwards. Objective: p95 <= 50 ms with >= 99% success.
Model inputs from a staircase of calibration passes at 50, 755 and 1,307 req/s (each rate up and down again): the median of 3 replicate sets from the 1,307 req/s passes, CPU per request net of the 20 s at rest:
| Input | Value | How it was measured |
|---|---|---|
serviceTimeMs |
lognormal, median 0.806 ms, p95 3.0617 ms | the median of 3 replicates (second): mean = the Flask service (gunicorn)'s CPU per request at 1307 req/s net of idle: (43988 - 65 ms at rest) / 39211 requests = 1.1202 ms; shape (p95/median 1.1163/0.2938 ms) from the handler's own time |
clientLinkLatencyMs |
0 ms | the median of 3 replicates (second): anchored: (measured median 1.346 ms - the model's median without it 2.108 ms at 1307 req/s) / 2, one way, at least 0 |
serviceTimeByLoad |
x1.58 at 50, x1.00 at 755, x1.00 at 1,307 req/s | the median of 3 replicates (first): the staircase's CPU per request net of idle (1.7054 ms at 50, 1.0087 ms at 755, 1.1202 ms at 1307 req/s), fitted never rising with rate and divided by the top rate's (1.1202 ms); flat outside the staircase |
gcPauseMs |
0 ms | the median of 3 replicates (first): not modelled as a pause: each gunicorn worker collects on its own and stalls only its own request; the collections' CPU is in the CPU per request |
writeServiceTimeMs |
lognormal, median 0.0878 ms, p95 0.8361 ms | the median of 3 replicates (first): PostgreSQL's CPU per UPDATE with synchronous_commit off (0.2245 ms), shaped like its round trip (median 0.455, p95 4.331 ms) |
readServiceTimeMs |
lognormal, median 0.069 ms, p95 0.6523 ms | the median of 3 replicates (first): PostgreSQL's CPU per SELECT (0.1753 ms, the pass's less its UPDATEs'), shaped like its round trip (median 0.424, p95 4.010 ms) |
dbLinkLatencyMs |
lognormal, median 0.1123 ms, p95 1.7454 ms | the median of 3 replicates (first): each way: the round trip the service measured less PostgreSQL's time, in two legs that keep its mean and variance (median 0.1123, p95 1.7454 ms) |
dbCpuShare |
1 | the median of 3 replicates (second): PostgreSQL CPU per query at the top pass net of idle (0.1824 ms) / the model's mean time per query (35238 reads at 0.178 ms and 3973 writes without their flush at 0.223 ms: 0.182 ms) |
commitFlushMs |
lognormal, median 1.0903 ms, p95 1.1012 ms | the median of 3 replicates (first): PostgreSQL's own WAL flushes at 1307 req/s (pg_stat_wal): 3940 flushes of 1.090 ms on average, 0.99 commits per flush (the model: 1.00); shaped like the commit wait the service measured (p95/median 1.01, mean 1.285 ms) |
serviceMemoryBaselineMb |
326.529 | the median of 3 replicates (first): at idle: the api-python container's working set (the highest reading in each pass) against req/s over 8 points (at rest and 7 passes, 50 to 1,307 req/s), by non-negative least squares: 326.5 MiB + 0.0013 MiB per req/s, largest error at and above the median rate 3% |
serviceMemoryPerRpsMb |
0.00126 | the median of 3 replicates (first): per req/s: the api-python container's working set (the highest reading in each pass) against req/s over 8 points (at rest and 7 passes, 50 to 1,307 req/s), by non-negative least squares: 326.5 MiB + 0.0013 MiB per req/s, largest error at and above the median rate 3% |
serviceMemoryPerRequestMb |
0.01 | the median of 3 replicates (first): per request held: the floor, since the fit against req/s explains the whole working set (held requests' memory would count twice otherwise) |
Measured in the calibration pass at 1,307 req/s: p50 1.31 ms, p95 8.58 ms.
| Offered req/s | p50 meas / pred (ms) | p95 meas / pred (ms) | p95 error | p99 meas / pred (ms) | Success meas / pred | Throughput meas / pred |
|---|---|---|---|---|---|---|
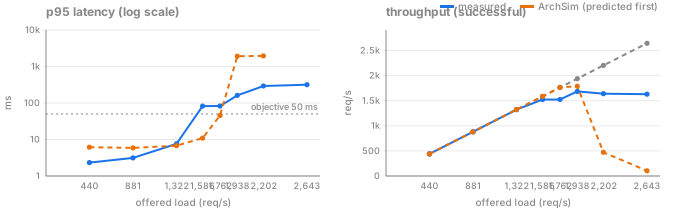
| 440 | 1.00 / 1.84 | 2.33 / 6.14 | +164% | 3.80 / 11.3 | 100% / 100% | 440 / 440 |
| 881 | 1.05 / 1.80 | 3.13 / 5.90 | +88% | 6.15 / 11.3 | 100% / 100% | 881 / 881 |
| 1,322 | 1.35 / 2.11 | 7.60 / 6.78 | -11% | 18.1 / 11.8 | 100% / 100% | 1,322 / 1,322 |
| 1,586 | 3.85 / 3.07 | 82.5 / 10.9 | -87% | 95.9 / 16.5 | 96% / 100% | 1,523 / 1,586 |
| 1,762 | 12.6 / 15.6 | 82.6 / 45.4 | -45% | 119 / 63.6 | 86% / 100% | 1,524 / 1,765 |
| 1,938 | 109 / 1,215 | 162 / 1,916 | +1086% | 185 / 1,994 | 87% / 91% | 1,684 / 1,788 |
| 2,202 | 192 / 1,572 | 292 / 1,954 | +569% | 328 / 1,994 | 74% / 16% | 1,640 / 471 |
| 2,643 | 218 / - | 316 / - | - | 362 / - | 62% / 0% | 1,630 / 103 |
Knee: measured 1,388 req/s, predicted 1,762 req/s on the same steps (+27%); ArchSim's own search before measuring put it at 1,762 req/s. Its predicted 80% range was 1,314 to 2,363 req/s: the measured knee fell inside it. Data: benchmarks/results/python-mixed/ (each repeat's numbers as extracted from k6's summary; the summaries themselves are not kept).
chain#
Node.js gateway, Node.js API, PostgreSQL in a chain: 90% reads, 10% writes over 100,000 rows. Calibrated 2026-11-04T05:34:15Z, predicted 2026-11-04T05:41:42Z (engine 0.16.0), measured afterwards. Objective: p95 <= 50 ms with >= 99% success.
Model inputs from a staircase of calibration passes at 50, 728, 2,120 and 2,816 req/s (each rate up and down again): the median of 3 replicate sets from the 2,816 req/s passes, CPU per request net of the 20 s at rest:
| Input | Value | How it was measured |
|---|---|---|
serviceTimeMs |
lognormal, median 0.1966 ms, p95 0.4555 ms | the median of 3 replicates (first): mean = Node's CPU per request at 2816 req/s net of idle: (18891 - 3 ms at rest) / 84314 requests = 0.2240 ms; shape (p95/median 0.0037/0.0016 ms) from the handler's own time |
clientLinkLatencyMs |
0 ms | the median of 3 replicates (second): anchored: (measured median 1.009 ms - the model's median without it 1.164 ms at 2816 req/s) / 2, one way, at least 0 |
serviceTimeByLoad |
x3.75 at 50, x1.35 at 728, x1.04 at 2,120, x1.00 at 2,816 req/s | the median of 3 replicates (first): the staircase's CPU per request net of idle (0.8403 ms at 50, 0.3024 ms at 728, 0.2326 ms at 2120, 0.2240 ms at 2816 req/s), fitted never rising with rate and divided by the top rate's (0.2240 ms); flat outside the staircase |
gcPauseMs |
8.3874 ms | the median of 3 replicates (third): V8's mark-compact cycles in the pass: 9.8 ms (incremental 5.2 ms, major 4.6 ms) over 1 cycles, a mean of 9.795 ms (the model's median: mean / 1.17); 69 scavenges, 91.4 ms, left in the CPU per request |
apiServiceTimeMs |
lognormal, median 0.1613 ms, p95 0.3759 ms | the median of 3 replicates (second): mean = the API's CPU per extra request between the passes: (16296 - 1026 ms) / (84449 - 1501 requests) = 0.1841 ms; shape (p95/median 0.0083/0.0035 ms) from its handler's own time |
apiLinkLatencyMs |
0.156 ms | the median of 3 replicates (second): (the gateway's call to the API, median 0.640 ms - the API's handler median 0.328 ms) / 2, one way |
writeServiceTimeMs |
lognormal, median 0.0924 ms, p95 0.7588 ms | the median of 3 replicates (third): PostgreSQL's CPU per UPDATE with synchronous_commit off (0.2097 ms), shaped like its round trip (median 0.334, p95 2.738 ms) |
readServiceTimeMs |
lognormal, median 0.142 ms, p95 0.5351 ms | the median of 3 replicates (third): PostgreSQL's CPU per SELECT (0.1966 ms, the pass's less its UPDATEs'), shaped like its round trip (median 0.312, p95 1.175 ms) |
dbLinkLatencyMs |
lognormal, median 0.0483 ms, p95 0.4775 ms | the median of 3 replicates (second): each way: the round trip the service measured less PostgreSQL's time, in two legs that keep its mean and variance (median 0.0483, p95 0.4775 ms) |
dbCpuShare |
1 | the median of 3 replicates (second): PostgreSQL CPU per query at the top pass net of idle (0.1981 ms) / the model's mean time per query (75803 reads at 0.196 ms and 8646 writes without their flush at 0.212 ms: 0.198 ms) |
commitFlushMs |
lognormal, median 1.0806 ms, p95 1.0914 ms | the median of 3 replicates (third): PostgreSQL's own WAL flushes at 2816 req/s (pg_stat_wal): 8237 flushes of 1.081 ms on average, 1.03 commits per flush (the model: 1.03); shaped like the commit wait the service measured (p95/median 1.01, mean 1.148 ms) |
serviceMemoryBaselineMb |
44.131 | the median of 3 replicates (first): at idle: the gateway container's working set (the highest reading in each pass) against req/s over 10 points (at rest and 9 passes, 50 to 2,816 req/s), by non-negative least squares: 44.1 MiB + 0.0214 MiB per req/s, largest error at and above the median rate 56% |
serviceMemoryPerRpsMb |
0.021443 | the median of 3 replicates (first): per req/s: the gateway container's working set (the highest reading in each pass) against req/s over 10 points (at rest and 9 passes, 50 to 2,816 req/s), by non-negative least squares: 44.1 MiB + 0.0214 MiB per req/s, largest error at and above the median rate 56% |
serviceMemoryPerRequestMb |
0.01 | the median of 3 replicates (first): per request held: the floor, since the fit against req/s explains the whole working set (held requests' memory would count twice otherwise) |
apiMemoryBaselineMb |
52.756 | the median of 3 replicates (first): at idle: the chain-api container's working set (the highest reading in each pass) against req/s over 10 points (at rest and 9 passes, 50 to 2,816 req/s), by non-negative least squares: 52.8 MiB + 0.0278 MiB per req/s, largest error at and above the median rate 117% |
apiMemoryPerRpsMb |
0.027767 | the median of 3 replicates (first): per req/s: the chain-api container's working set (the highest reading in each pass) against req/s over 10 points (at rest and 9 passes, 50 to 2,816 req/s), by non-negative least squares: 52.8 MiB + 0.0278 MiB per req/s, largest error at and above the median rate 117% |
apiMemoryPerRequestMb |
0.01 | the median of 3 replicates (first): per request held: the floor, since the fit against req/s explains the whole working set (held requests' memory would count twice otherwise) |
gcEveryRequests |
84449 | the median of the 2 of 3 replicates with it (second): 84449 requests / 1 mark-compact cycles in the pass |
Measured in the calibration pass at 2,816 req/s: p50 1.01 ms, p95 9.04 ms.
| Offered req/s | p50 meas / pred (ms) | p95 meas / pred (ms) | p95 error | p99 meas / pred (ms) | Success meas / pred | Throughput meas / pred |
|---|---|---|---|---|---|---|
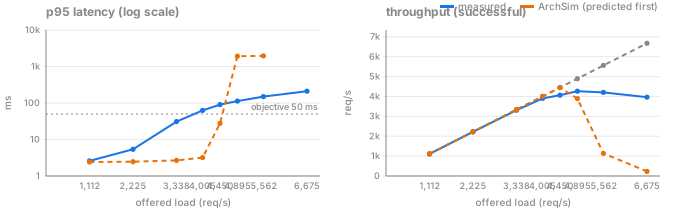
| 1,112 | 0.81 / 1.16 | 2.58 / 2.42 | -6% | 5.43 / 3.32 | 100% / 100% | 1,112 / 1,112 |
| 2,225 | 0.91 / 1.14 | 5.38 / 2.47 | -54% | 16.1 / 3.46 | 100% / 100% | 2,225 / 2,225 |
| 3,338 | 1.44 / 1.24 | 30.9 / 2.67 | -91% | 68.4 / 3.67 | 99% / 100% | 3,309 / 3,338 |
| 4,005 | 2.98 / 1.48 | 62.6 / 3.20 | -95% | 103 / 5.04 | 97% / 100% | 3,902 / 4,005 |
| 4,450 | 21.6 / 13.8 | 90.6 / 27.7 | -69% | 118 / 31.8 | 91% / 100% | 4,064 / 4,448 |
| 4,895 | 48.4 / 1,264 | 113 / 1,916 | +1595% | 160 / 1,994 | 87% / 77% | 4,265 / 3,891 |
| 5,562 | 82.8 / 1,603 | 149 / 1,954 | +1209% | 219 / 1,994 | 76% / 15% | 4,203 / 1,136 |
| 6,675 | 105 / - | 211 / - | - | 298 / - | 59% / 0% | 3,962 / 230 |
Knee: measured 3,388 req/s, predicted 4,455 req/s on the same steps (+32%); ArchSim's own search before measuring put it at 4,450 req/s. Its predicted 80% range was 3,339 to 5,931 req/s: the measured knee fell inside it. Data: benchmarks/results/chain/ (each repeat's numbers as extracted from k6's summary; the summaries themselves are not kept).
cache-ttl#
Cache-aside: Node.js, Redis (5 s TTL) and PostgreSQL; Zipf 1.1 over 1,000,000 keys. Calibrated 2026-11-04T06:11:13Z, predicted 2026-11-04T06:16:50Z (engine 0.16.0), measured afterwards. Objective: p95 <= 50 ms with >= 99% success.
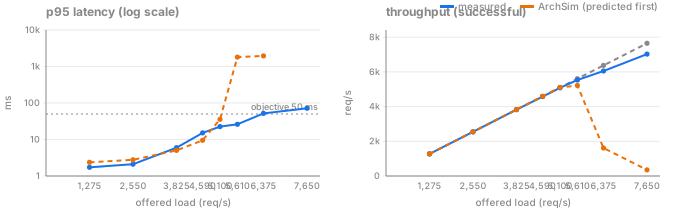
Model inputs from a staircase of calibration passes at 50, 617, 1,713, 2,863 and 3,262 req/s (each rate up and down again): the median of 3 replicate sets from the 3,262 req/s passes, CPU per request net of the 20 s at rest:
| Input | Value | How it was measured |
|---|---|---|
serviceTimeMs |
lognormal, median 0.0838 ms, p95 0.6962 ms | the median of 3 replicates (second): mean = Node's CPU per request at 3262 req/s net of idle: (18782 - 5 ms at rest) / 97859 requests = 0.1919 ms; shape (p95/median 0.0822/0.0058 ms) from the handler's own time; spread anchored: p95/median 8.31 instead of 14.21, so that the model's p95 - p50 at 3262 req/s is k6's: 2.969 against 3.075 ms |
clientLinkLatencyMs |
0 ms | the median of 3 replicates (second): anchored: (measured median 0.526 ms - the model's median without it 0.571 ms at 3262 req/s) / 2, one way, at least 0 |
serviceTimeByLoad |
x5.05 at 50, x1.84 at 617, x1.19 at 1,713, x1.04 at 2,863, x1.00 at 3,262 req/s | the median of 3 replicates (first): the staircase's CPU per request net of idle (0.9687 ms at 50, 0.3527 ms at 617, 0.2276 ms at 1713, 0.1995 ms at 2863, 0.1919 ms at 3262 req/s), fitted never rising with rate and divided by the top rate's (0.1919 ms); flat outside the staircase |
gcPauseMs |
9.3017 ms | the median of 3 replicates (third): V8's mark-compact cycles in the pass: 21.7 ms (incremental 11.9 ms, major 9.8 ms) over 2 cycles, a mean of 10.863 ms (the model's median: mean / 1.17); 117 scavenges, 110.0 ms, left in the CPU per request |
gcEveryRequests |
48905 | the median of the 2 of 3 replicates with it (first): 97810 requests / 2 mark-compact cycles in the pass |
readServiceTimeMs |
lognormal, median 0.1417 ms, p95 0.5413 ms | the median of 3 replicates (second): PostgreSQL's CPU per SELECT (0.1975 ms), shaped like its round trip (median 0.299, p95 1.140 ms) |
dbLinkLatencyMs |
lognormal, median 0.0436 ms, p95 0.4055 ms | the median of 3 replicates (second): each way: the round trip the service measured less PostgreSQL's time, in two legs that keep its mean and variance (median 0.0436, p95 0.4055 ms) |
dbCpuShare |
1 | the median of 3 replicates (second): PostgreSQL CPU per query at the top pass net of idle (0.1975 ms) / the model's mean time per query (31423 reads at 0.197 ms: 0.197 ms) |
cacheServiceTimeMs |
exponential, mean 0.03477 ms | the median of 3 replicates (second): mean = Redis's CPU per command at 3262 req/s net of idle: (4737 - 242 ms at rest) / 129282 GET/SET calls = 0.0348 ms (its command time alone, INFO commandstats: 346649 us over 129282 GET/SET calls = 0.0027 ms; the rest is reading requests and writing replies) |
cacheLinkLatencyMs |
0.0574 ms | the median of 3 replicates (second): (GET round trip median 0.139 ms - the command time's median 0.0241 ms) / 2, one way |
serviceMemoryBaselineMb |
58.723 | the median of 3 replicates (first): at idle: the api-ttl container's working set (the highest reading in each pass) against req/s over 12 points (at rest and 11 passes, 50 to 3,262 req/s), by non-negative least squares: 58.7 MiB + 0.0243 MiB per req/s, largest error at and above the median rate 101% |
serviceMemoryPerRpsMb |
0.024251 | the median of 3 replicates (first): per req/s: the api-ttl container's working set (the highest reading in each pass) against req/s over 12 points (at rest and 11 passes, 50 to 3,262 req/s), by non-negative least squares: 58.7 MiB + 0.0243 MiB per req/s, largest error at and above the median rate 101% |
serviceMemoryPerRequestMb |
0.01 | the median of 3 replicates (first): per request held: the floor, since the fit against req/s explains the whole working set (held requests' memory would count twice otherwise) |
Measured in the calibration pass at 3,262 req/s: p50 0.53 ms, p95 3.60 ms.
| Offered req/s | p50 meas / pred (ms) | p95 meas / pred (ms) | p95 error | p99 meas / pred (ms) | Success meas / pred | Throughput meas / pred | Hit ratio meas / pred |
|---|---|---|---|---|---|---|---|
| 1,275 | 0.52 / 0.47 | 1.73 / 2.37 | +37% | 3.66 / 5.79 | 100% / 100% | 1,275 / 1,275 | 62% / 62% |
| 2,550 | 0.47 / 0.50 | 2.11 / 2.78 | +32% | 8.03 / 5.79 | 100% / 100% | 2,550 / 2,550 | 67% / 67% |
| 3,825 | 0.56 / 0.74 | 5.96 / 5.04 | -15% | 17.7 / 11.1 | 100% / 100% | 3,825 / 3,825 | 69% / 69% |
| 4,590 | 0.64 / 1.60 | 15.1 / 9.50 | -37% | 37.8 / 18.6 | 100% / 100% | 4,578 / 4,589 | 70% / 70% |
| 5,100 | 0.72 / 8.43 | 22.6 / 35.8 | +58% | 49.0 / 48.2 | 100% / 100% | 5,082 / 5,102 | 71% / 71% |
| 5,610 | 0.82 / 1,101 | 26.1 / 1,806 | +6822% | 61.1 / 1,954 | 99% / 98% | 5,532 / 5,218 | 71% / 71% |
| 6,375 | 1.45 / 1,572 | 51.8 / 1,954 | +3670% | 98.5 / 1,994 | 95% / 21% | 6,052 / 1,614 | 72% / 71% |
| 7,650 | 2.12 / - | 71.6 / - | - | 115 / - | 92% / 0% | 7,023 / 352 | 72% / 71% |
Knee: measured 5,420 req/s, predicted 5,104 req/s on the same steps (-6%); ArchSim's own search before measuring put it at 5,100 req/s. Its predicted 80% range was 3,826 to 6,798 req/s: the measured knee fell inside it. Data: benchmarks/results/cache-ttl/ (each repeat's numbers as extracted from k6's summary; the summaries themselves are not kept).
pg-mixed#
Node.js + PostgreSQL: 90% reads, 10% writes over 100,000 rows. Calibrated 2026-11-04T11:52:16Z, predicted 2026-11-04T11:58:24Z (engine 0.16.0), measured afterwards. Objective: p95 <= 50 ms with >= 99% success.
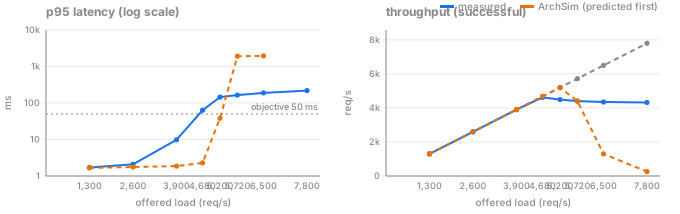
Model inputs from a staircase of calibration passes at 50, 793, 2,610 and 3,262 req/s (each rate up and down again): the median of 3 replicate sets from the 3,262 req/s passes, CPU per request net of the 20 s at rest:
| Input | Value | How it was measured |
|---|---|---|
serviceTimeMs |
lognormal, median 0.1725 ms, p95 0.3702 ms | the median of 3 replicates (second): mean = Node's CPU per request at 3262 req/s net of idle: (18807 - 4 ms at rest) / 97860 requests = 0.1921 ms; shape (p95/median 0.0072/0.0034 ms) from the handler's own time |
clientLinkLatencyMs |
0.001 ms | the median of 3 replicates (second): anchored: (measured median 0.551 ms - the model's median without it 0.548 ms at 3262 req/s) / 2, one way, at least 0 |
serviceTimeByLoad |
x4.03 at 50, x1.31 at 793, x1.04 at 2,610, x1.00 at 3,262 req/s | the median of 3 replicates (first): the staircase's CPU per request net of idle (0.7740 ms at 50, 0.2513 ms at 793, 0.1996 ms at 2610, 0.1921 ms at 3262 req/s), fitted never rising with rate and divided by the top rate's (0.1921 ms); flat outside the staircase |
gcPauseMs |
7.124 ms | the median of 3 replicates (first): V8's mark-compact cycles in the pass: 8.3 ms (incremental 3.3 ms, major 5.0 ms) over 1 cycles, a mean of 8.320 ms (the model's median: mean / 1.17); 56 scavenges, 83.5 ms, left in the CPU per request |
gcEveryRequests |
48930 | the median of the 2 of 3 replicates with it (third): 97861 requests / 2 mark-compact cycles in the pass |
writeServiceTimeMs |
lognormal, median 0.0598 ms, p95 0.7606 ms | the median of 3 replicates (third): PostgreSQL's CPU per UPDATE with synchronous_commit off (0.1976 ms), shaped like its round trip (median 0.282, p95 3.584 ms) |
readServiceTimeMs |
lognormal, median 0.1269 ms, p95 0.516 ms | the median of 3 replicates (second): PostgreSQL's CPU per SELECT (0.1826 ms, the pass's less its UPDATEs'), shaped like its round trip (median 0.270, p95 1.098 ms) |
dbLinkLatencyMs |
lognormal, median 0.0391 ms, p95 0.3856 ms | the median of 3 replicates (second): each way: the round trip the service measured less PostgreSQL's time, in two legs that keep its mean and variance (median 0.0391, p95 0.3856 ms) |
dbCpuShare |
0.9999 | the median of 3 replicates (third): PostgreSQL CPU per query at the top pass net of idle (0.1772 ms) / the model's mean time per query (88061 reads at 0.175 ms and 9800 writes without their flush at 0.198 ms: 0.177 ms) |
commitFlushMs |
lognormal, median 1.0093 ms, p95 1.0194 ms | the median of 3 replicates (third): PostgreSQL's own WAL flushes at 3262 req/s (pg_stat_wal): 9550 flushes of 1.009 ms on average, 1.03 commits per flush (the model: 1.04); shaped like the commit wait the service measured (p95/median 1.01, mean 1.087 ms) |
serviceMemoryBaselineMb |
73.125 | the median of 3 replicates (first): at idle: the api container's working set (the highest reading in each pass) against req/s over 10 points (at rest and 9 passes, 50 to 3,262 req/s), by non-negative least squares: 73.1 MiB + 0.0208 MiB per req/s, largest error at and above the median rate 106% |
serviceMemoryPerRpsMb |
0.020773 | the median of 3 replicates (first): per req/s: the api container's working set (the highest reading in each pass) against req/s over 10 points (at rest and 9 passes, 50 to 3,262 req/s), by non-negative least squares: 73.1 MiB + 0.0208 MiB per req/s, largest error at and above the median rate 106% |
serviceMemoryPerRequestMb |
0.01 | the median of 3 replicates (first): per request held: the floor, since the fit against req/s explains the whole working set (held requests' memory would count twice otherwise) |
Measured in the calibration pass at 3,262 req/s: p50 0.54 ms, p95 2.93 ms.
| Offered req/s | p50 meas / pred (ms) | p95 meas / pred (ms) | p95 error | p99 meas / pred (ms) | Success meas / pred | Throughput meas / pred |
|---|---|---|---|---|---|---|
| 1,300 | 0.48 / 0.56 | 1.71 / 1.66 | -3% | 3.04 / 2.47 | 100% / 100% | 1,300 / 1,300 |
| 2,600 | 0.52 / 0.54 | 2.09 / 1.76 | -16% | 6.07 / 2.73 | 100% / 100% | 2,600 / 2,600 |
| 3,900 | 0.69 / 0.57 | 9.78 / 1.87 | -81% | 33.8 / 2.95 | 100% / 100% | 3,900 / 3,900 |
| 4,680 | 2.12 / 0.72 | 63.6 / 2.28 | -96% | 81.0 / 6.65 | 99% / 100% | 4,622 / 4,680 |
| 5,200 | 91.6 / 15.3 | 145 / 38.0 | -74% | 173 / 42.8 | 86% / 100% | 4,490 / 5,191 |
| 5,720 | 115 / 1,239 | 165 / 1,916 | +1062% | 212 / 1,994 | 77% / 75% | 4,403 / 4,399 |
| 6,500 | 126 / 1,635 | 189 / 1,954 | +934% | 228 / 1,994 | 67% / 15% | 4,348 / 1,298 |
| 7,800 | 141 / - | 219 / - | - | 302 / - | 55% / 0% | 4,319 / 259 |
Knee: measured 4,483 req/s, predicted 5,203 req/s on the same steps (+16%); ArchSim's own search before measuring put it at 5,200 req/s. Its predicted 80% range was 3,902 to 6,931 req/s: the measured knee fell inside it. Data: benchmarks/results/pg-mixed/ (each repeat's numbers as extracted from k6's summary; the summaries themselves are not kept).
pg-hot-row#
Node.js + PostgreSQL: every request updates the same row. Calibrated 2026-11-04T12:24:30Z, predicted 2026-11-04T12:25:37Z (engine 0.16.0), measured afterwards. Objective: p95 <= 50 ms with >= 99% success.
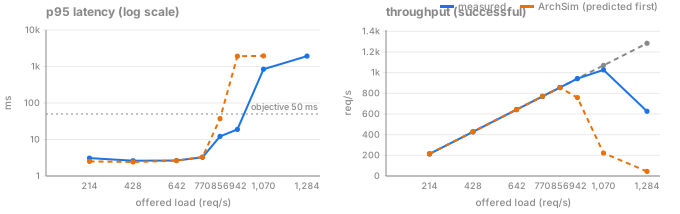
Model inputs from a staircase of calibration passes at 50, 206, 327 and 363 req/s (each rate up and down again): the median of 3 replicate sets from the 363 req/s passes, CPU per request net of the 20 s at rest:
| Input | Value | How it was measured |
|---|---|---|
serviceTimeMs |
lognormal, median 0.2541 ms, p95 0.8105 ms | the median of 3 replicates (second): mean = Node's CPU per request at 363 req/s net of idle: (3560 - 4 ms at rest) / 10891 requests = 0.3265 ms, less the 0.0007 ms per request of the pauses modelled as GC (gcPauseMs) = 0.3259 ms; shape (p95/median 0.0159/0.0050 ms) from the handler's own time |
clientLinkLatencyMs |
0 ms | the median of 3 replicates (second): anchored: (measured median 1.421 ms - the model's median without it 1.536 ms at 363 req/s) / 2, one way, at least 0 |
serviceTimeByLoad |
x2.33 at 50, x1.29 at 206, x1.06 at 327, x1.00 at 363 req/s | the median of 3 replicates (first): the staircase's CPU per request net of idle (0.7621 ms at 50, 0.4214 ms at 206, 0.3460 ms at 327, 0.3265 ms at 363 req/s), fitted never rising with rate and divided by the top rate's (0.3265 ms); flat outside the staircase |
gcPauseMs |
6.2246 ms | the median of 3 replicates (second): V8's mark-compact cycles in the pass: 7.3 ms (incremental 3.9 ms, major 3.4 ms) over 1 cycles, a mean of 7.269 ms (the model's median: mean / 1.17); 83 scavenges, 34.5 ms, left in the CPU per request |
writeServiceTimeMs |
lognormal, median 0.2314 ms, p95 0.6362 ms | the median of 3 replicates (second): PostgreSQL's CPU per UPDATE with synchronous_commit off (0.2795 ms), shaped like its round trip (median 0.330, p95 0.908 ms) |
dbLinkLatencyMs |
lognormal, median 0.0239 ms, p95 0.2212 ms | the median of 3 replicates (second): each way: the round trip the service measured less PostgreSQL's time, in two legs that keep its mean and variance (median 0.0239, p95 0.2212 ms) |
dbCpuShare |
1 | the median of 3 replicates (second): PostgreSQL CPU per query at the top pass net of idle (0.3208 ms) / the model's mean time per query (10891 writes without their flush at 0.280 ms: 0.280 ms) |
commitFlushMs |
lognormal, median 0.8582 ms, p95 1.3022 ms | the median of 3 replicates (first): PostgreSQL's own WAL flushes at 363 req/s (pg_stat_wal): 10870 flushes of 0.886 ms on average, 1.00 commits per flush (the model: 1.00); shaped like the commit wait the service measured (p95/median 1.52, mean 0.839 ms) |
serviceMemoryBaselineMb |
73.07 | the median of 3 replicates (first): at idle: the api container's working set (the highest reading in each pass) against req/s over 10 points (at rest and 9 passes, 50 to 363 req/s), by non-negative least squares: 73.1 MiB + 0.0000 MiB per req/s, largest error at and above the median rate 66%; memory did not grow with the request rate over the range |
serviceMemoryPerRpsMb |
0 | the median of 3 replicates (first): per req/s: the api container's working set (the highest reading in each pass) against req/s over 10 points (at rest and 9 passes, 50 to 363 req/s), by non-negative least squares: 73.1 MiB + 0.0000 MiB per req/s, largest error at and above the median rate 66%; memory did not grow with the request rate over the range |
serviceMemoryPerRequestMb |
0.01 | the median of 3 replicates (first): per request held: the floor, since the fit against req/s explains the whole working set (held requests' memory would count twice otherwise) |
gcEveryRequests |
10891 | the median of the 2 of 3 replicates with it (second): 10891 requests / 1 mark-compact cycles in the pass |
Measured in the calibration pass at 363 req/s: p50 1.42 ms, p95 2.76 ms.
| Offered req/s | p50 meas / pred (ms) | p95 meas / pred (ms) | p95 error | p99 meas / pred (ms) | Success meas / pred | Throughput meas / pred |
|---|---|---|---|---|---|---|
| 214 | 1.67 / 1.60 | 3.08 / 2.52 | -18% | 3.64 / 3.13 | 100% / 100% | 214 / 214 |
| 428 | 1.29 / 1.54 | 2.63 / 2.42 | -8% | 4.04 / 3.07 | 100% / 100% | 428 / 428 |
| 642 | 1.23 / 1.63 | 2.66 / 2.62 | -1% | 4.91 / 3.39 | 100% / 100% | 642 / 642 |
| 770 | 1.22 / 1.91 | 3.26 / 3.32 | +2% | 8.01 / 4.39 | 100% / 100% | 770 / 770 |
| 856 | 1.32 / 7.95 | 12.2 / 37.2 | +206% | 76.6 / 41.9 | 100% / 100% | 856 / 854 |
| 942 (unstable) | 1.72 / 1,239 | 19.0 / 1,916 | +10003% | 37.1 / 1,994 | 100% / 78% | 942 / 758 |
| 1,070 (unstable) | 382 / 1,603 | 845 / 1,954 | +131% | 877 / 1,994 | 96% / 16% | 1,026 / 222 |
| 1,284 | 1,196 / - | 1,930 / - | - | 1,972 / - | 49% / 0% | 626 / 45 |
Unstable: the step's repeats' p95s differ by more than 2x across the objective (a repeat with no successful request counts as slower than any).
Knee: measured 947 req/s, predicted 857 req/s on the same steps (-10%); ArchSim's own search before measuring put it at 856 req/s. Its predicted 80% range was 678 to 1,080 req/s: the measured knee fell inside it. Data: benchmarks/results/pg-hot-row/ (each repeat's numbers as extracted from k6's summary; the summaries themselves are not kept).
cache-aside#
Cache-aside: Node.js, Redis (30 s TTL) and PostgreSQL; Zipf 0.99 over 100,000 keys. Calibrated 2026-11-04T12:50:54Z, predicted 2026-11-04T12:56:51Z (engine 0.16.0), measured afterwards. Objective: p95 <= 50 ms with >= 99% success.
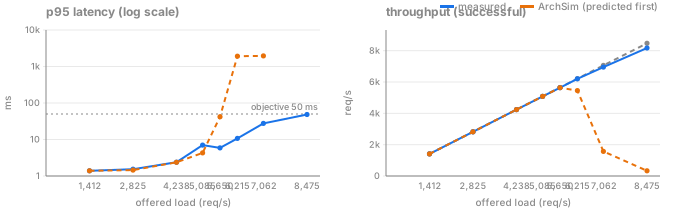
Model inputs from a staircase of calibration passes at 50, 651, 2,052 and 3,470 req/s (each rate up and down again): the median of 3 replicate sets from the 3,470 req/s passes, CPU per request net of the 20 s at rest:
| Input | Value | How it was measured |
|---|---|---|
serviceTimeMs |
lognormal, median 0.1036 ms, p95 0.5604 ms | the median of 3 replicates (second): mean = Node's CPU per request at 3470 req/s net of idle: (18266 - 5 ms at rest) / 104101 requests = 0.1754 ms; shape (p95/median 0.0671/0.0058 ms) from the handler's own time; spread anchored: p95/median 5.41 instead of 11.60, so that the model's p95 - p50 at 3470 req/s is k6's: 1.272 against 1.246 ms |
clientLinkLatencyMs |
0 ms | the median of 3 replicates (second): anchored: (measured median 0.401 ms - the model's median without it 0.407 ms at 3470 req/s) / 2, one way, at least 0 |
serviceTimeByLoad |
x5.21 at 50, x1.74 at 651, x1.09 at 2,052, x1.00 at 3,470 req/s | the median of 3 replicates (first): the staircase's CPU per request net of idle (0.9139 ms at 50, 0.3047 ms at 651, 0.1917 ms at 2052, 0.1754 ms at 3470 req/s), fitted never rising with rate and divided by the top rate's (0.1754 ms); flat outside the staircase |
gcPauseMs |
0 ms | the median of 3 replicates (second): no mark-compact in the pass; 28 scavenges, 47.1 ms, left in the CPU per request |
readServiceTimeMs |
lognormal, median 0.1621 ms, p95 0.5274 ms | the median of 3 replicates (second): PostgreSQL's CPU per SELECT (0.2097 ms), shaped like its round trip (median 0.290, p95 0.945 ms) |
dbLinkLatencyMs |
lognormal, median 0.0346 ms, p95 0.3047 ms | the median of 3 replicates (second): each way: the round trip the service measured less PostgreSQL's time, in two legs that keep its mean and variance (median 0.0346, p95 0.3047 ms) |
dbCpuShare |
1 | the median of 3 replicates (second): PostgreSQL CPU per query at the top pass net of idle (0.2097 ms) / the model's mean time per query (24644 reads at 0.210 ms: 0.210 ms) |
cacheServiceTimeMs |
exponential, mean 0.03452 ms | the median of 3 replicates (second): mean = Redis's CPU per command at 3470 req/s net of idle: (4704 - 260 ms at rest) / 128745 GET/SET calls = 0.0345 ms (its command time alone, INFO commandstats: 349978 us over 128745 GET/SET calls = 0.0027 ms; the rest is reading requests and writing replies) |
cacheLinkLatencyMs |
0.0536 ms | the median of 3 replicates (second): (GET round trip median 0.131 ms - the command time's median 0.0239 ms) / 2, one way |
serviceMemoryBaselineMb |
75.177 | the median of 3 replicates (first): at idle: the api container's working set (the highest reading in each pass) against req/s over 10 points (at rest and 9 passes, 50 to 3,470 req/s), by non-negative least squares: 75.2 MiB + 0.0136 MiB per req/s, largest error at and above the median rate 74% |
serviceMemoryPerRpsMb |
0.013554 | the median of 3 replicates (first): per req/s: the api container's working set (the highest reading in each pass) against req/s over 10 points (at rest and 9 passes, 50 to 3,470 req/s), by non-negative least squares: 75.2 MiB + 0.0136 MiB per req/s, largest error at and above the median rate 74% |
serviceMemoryPerRequestMb |
0.01 | the median of 3 replicates (first): per request held: the floor, since the fit against req/s explains the whole working set (held requests' memory would count twice otherwise) |
Measured in the calibration pass at 3,470 req/s: p50 0.40 ms, p95 1.69 ms.
| Offered req/s | p50 meas / pred (ms) | p95 meas / pred (ms) | p95 error | p99 meas / pred (ms) | Success meas / pred | Throughput meas / pred | Hit ratio meas / pred |
|---|---|---|---|---|---|---|---|
| 1,412 | 0.41 / 0.40 | 1.39 / 1.39 | 0% | 3.28 / 2.57 | 100% / 100% | 1,412 / 1,412 | 70% / 70% |
| 2,825 | 0.41 / 0.38 | 1.54 / 1.45 | -6% | 4.44 / 2.62 | 100% / 100% | 2,825 / 2,825 | 75% / 75% |
| 4,238 | 0.43 / 0.54 | 2.38 / 2.37 | 0% | 8.38 / 3.97 | 100% / 100% | 4,238 / 4,238 | 79% / 79% |
| 5,085 | 0.52 / 0.99 | 7.03 / 4.30 | -39% | 23.7 / 6.92 | 100% / 100% | 5,085 / 5,086 | 80% / 80% |
| 5,650 | 0.51 / 9.31 | 5.87 / 41.9 | +614% | 22.3 / 55.3 | 100% / 100% | 5,639 / 5,635 | 81% / 81% |
| 6,215 | 0.56 / 1,191 | 10.7 / 1,916 | +17808% | 35.1 / 1,994 | 100% / 86% | 6,208 / 5,453 | 82% / 81% |
| 7,062 | 0.81 / 1,603 | 27.6 / 1,954 | +6979% | 63.1 / 1,994 | 98% / 17% | 6,955 / 1,568 | 83% / 81% |
| 8,475 | 1.04 / - | 48.4 / - | - | 77.6 / - | 96% / 0% | 8,175 / 332 | 84% / 81% |
Knee: measured 6,752 req/s, predicted 5,652 req/s on the same steps (-16%); ArchSim's own search before measuring put it at 5,650 req/s. Its predicted 80% range was 4,238 to 7,533 req/s: the measured knee fell inside it. Data: benchmarks/results/cache-aside/ (each repeat's numbers as extracted from k6's summary; the summaries themselves are not kept).
kafka#
Kafka: Node.js producer, 6 partitions, 3 consumers inserting into PostgreSQL. Calibrated 2026-11-04T13:27:44Z, predicted 2026-11-04T13:31:42Z (engine 0.16.0), measured afterwards. Objective: p95 <= 50 ms with >= 99% success.
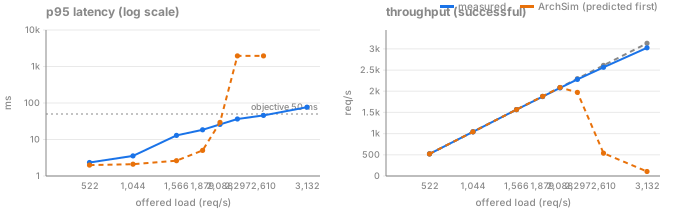
Model inputs from a staircase of calibration passes at 50 and 406 req/s (each rate up and down again): the median of 3 replicate sets from the 406 req/s passes, CPU per request net of the 20 s at rest:
| Input | Value | How it was measured |
|---|---|---|
serviceTimeMs |
lognormal, median 0.3983 ms, p95 1.0499 ms | the median of 3 replicates (second): mean = Node's CPU per request at 406 req/s net of idle: (7244 - 1450 ms at rest) / 12181 requests = 0.4757 ms, less the 0.0019 ms per request of the pauses modelled as GC (gcPauseMs) = 0.4738 ms; shape (p95/median 0.0248/0.0094 ms) from the handler's own time |
clientLinkLatencyMs |
0 ms | the median of 3 replicates (second): anchored: (measured median 0.759 ms - the model's median without it 0.918 ms at 406 req/s) / 2, one way, at least 0 |
serviceTimeByLoad |
x1.30 at 50, x1.00 at 406 req/s | the median of 3 replicates (first): the staircase's CPU per request net of idle (0.6204 ms at 50, 0.4757 ms at 406 req/s), fitted never rising with rate and divided by the top rate's (0.4757 ms); flat outside the staircase |
gcPauseMs |
9.0117 ms | the median of 3 replicates (first): V8's mark-compact cycles in the pass: 21.0 ms (incremental 11.2 ms, major 9.8 ms) over 2 cycles, a mean of 10.524 ms (the model's median: mean / 1.17); 192 scavenges, 135.0 ms, left in the CPU per request |
gcEveryRequests |
6090 | the median of 3 replicates (first): 12181 requests / 2 mark-compact cycles in the pass |
publishTimeMs |
lognormal, median 0.466 ms, p95 1.2971 ms | the median of 3 replicates (third): producer.send with acks=all on one broker: median 0.466, p95 1.297 ms |
consumerTimeMs |
lognormal, median 0.0104 ms, p95 0.0223 ms | the median of 3 replicates (third): consumer's own time per message (handling minus the INSERT): median 0.010, p95 0.022 ms |
consumerConcurrency |
3 | the median of 3 replicates (first): the stack's setting, not measured: one kafkajs consumer processes 3 of its 6 partitions at once (partitionsConsumedConcurrently) |
fetchOverheadMs |
lognormal, median 1.0158 ms, p95 2.3875 ms | the median of 3 replicates (second): kafkajs's fetch cycle in the pass (10893 polls): each cycle less its batches' least span on 3 workers, median 1.016, p95 2.387 ms (the fetch: median 0.527 ms; the last batch's commit: median 0.375 ms) |
writeServiceTimeMs |
lognormal, median 0.2235 ms, p95 0.8493 ms | the median of 3 replicates (second): PostgreSQL's CPU per INSERT (0.3107 ms), shaped like the consumer's INSERT less its commit wait (median 1.186 - 0.761 ms, p95 2.374 - 0.761 ms) |
dbLinkLatencyMs |
lognormal, median 0.0527 ms, p95 0.5233 ms | the median of 3 replicates (second): each way: the round trip the service measured less PostgreSQL's time, in two legs that keep its mean and variance (median 0.0527, p95 0.5233 ms) |
dbCpuShare |
0.9999 | the median of 3 replicates (second): PostgreSQL CPU per query at the top pass net of idle (0.3107 ms) / the model's mean time per query (the INSERT, 0.311 ms) |
commitFlushMs |
lognormal, median 0.8839 ms, p95 1.4935 ms | the median of 3 replicates (third): PostgreSQL's own WAL flushes at 406 req/s (pg_stat_wal): 11911 flushes of 0.930 ms on average, 1.02 commits per flush (the model: 1.00); shaped like the commit wait the service measured (p95/median 1.69, mean 0.818 ms) |
serviceMemoryBaselineMb |
39.134 | the median of 3 replicates (first): at idle: the producer container's working set (the highest reading in each pass) against req/s over 6 points (at rest and 5 passes, 50 to 406 req/s), by non-negative least squares: 39.1 MiB + 0.0187 MiB per req/s, largest error at and above the median rate 5% |
serviceMemoryPerRpsMb |
0.018737 | the median of 3 replicates (first): per req/s: the producer container's working set (the highest reading in each pass) against req/s over 6 points (at rest and 5 passes, 50 to 406 req/s), by non-negative least squares: 39.1 MiB + 0.0187 MiB per req/s, largest error at and above the median rate 5% |
serviceMemoryPerRequestMb |
0.01 | the median of 3 replicates (first): per request held: the floor, since the fit against req/s explains the whole working set (held requests' memory would count twice otherwise) |
Measured in the calibration pass at 406 req/s: p50 0.79 ms, p95 2.21 ms.
| Offered req/s | p50 meas / pred (ms) | p95 meas / pred (ms) | p95 error | p99 meas / pred (ms) | Success meas / pred | Throughput meas / pred | Consumed/s meas / pred | Message age p95 meas / pred (ms) |
|---|---|---|---|---|---|---|---|---|
| 522 | 0.75 / 0.94 | 2.35 / 1.99 | -15% | 6.57 / 2.84 | 100% / 100% | 522 / 522 | 522 / 522 | 10.0 / 7.20 |
| 1,044 | 0.83 / 0.97 | 3.56 / 2.11 | -41% | 12.7 / 3.13 | 100% / 100% | 1,044 / 1,044 | 1,044 / 1,044 | 66.0 / 18.6 |
| 1,566 | 0.80 / 1.10 | 12.9 / 2.62 | -80% | 33.4 / 4.47 | 100% / 100% | 1,566 / 1,566 | 1,566 / 1,426 | 1,835 / 2,847 |
| 1,879 | 0.84 / 1.48 | 18.5 / 5.04 | -73% | 60.3 / 14.1 | 100% / 100% | 1,875 / 1,879 | 1,735 / 1,443 | 7,173 / 6,164 |
| 2,088 | 0.86 / 10.3 | 26.0 / 29.4 | +13% | 56.7 / 31.8 | 100% / 100% | 2,080 / 2,089 | 1,740 / 1,442 | 8,596 / 10,112 |
| 2,297 | 0.94 / 1,290 | 36.4 / 1,954 | +5268% | 79.3 / 1,994 | 99% / 84% | 2,281 / 1,973 | 1,715 / 1,444 | 10,393 / 8,133 |
| 2,610 | 1.03 / 1,603 | 45.8 / 1,954 | +4167% | 103 / 1,994 | 98% / 16% | 2,565 / 537 | 1,690 / 1,445 | 12,242 / 8,461 |
| 3,132 | 2.14 / - | 76.9 / - | - | 120 / - | 97% / 0% | 3,024 / 107 | 1,670 / 1,449 | 15,098 / 8,979 |
Knee: measured 2,387 req/s, predicted 2,090 req/s on the same steps (-12%); ArchSim's own search before measuring put it at 2,088 req/s. Its predicted 80% range was 1,566 to 2,784 req/s: the measured knee fell inside it. Data: benchmarks/results/kafka/ (each repeat's numbers as extracted from k6's summary; the summaries themselves are not kept).
Resources: CPU and memory#
Besides latency and capacity, ArchSim predicts how busy each part's CPU is (busy cores) and, for a part with memory set, how much memory it holds. Auto-sizing picks instance types from those figures, so they are checked here against each container's own counters (cgroup v2) at every load step.
| Experiment | Part | Load step (req/s) | Busy cores measured | Busy cores predicted | Error | Median error up to both knees (steps) | Memory measured | Memory predicted | Error |
|---|---|---|---|---|---|---|---|---|---|
| java-mixed | Spring Boot service | 3,950 | 1.04 | 1.00 | -4% | 6% (2) | 874 MiB | 925 MiB | +6% |
| java-mixed | PostgreSQL | 3,950 | 0.63 | 0.59 | -6% | 4% (2) | 102 MiB | - | - |
| go-mixed | Go service | 4,950 | 0.97 | 1.00 | +2% | 5% (2) | 42 MiB | 33 MiB | -22% |
| go-mixed | PostgreSQL | 4,950 | 0.70 | 0.64 | -8% | 5% (2) | 110 MiB | - | - |
| python-mixed | Flask service (gunicorn) | 1,322 | 1.49 | 1.48 | -1% | 6% (3) | 340 MiB | 329 MiB | -3% |
| python-mixed | PostgreSQL | 1,322 | 0.25 | 0.23 | -6% | 6% (3) | 124 MiB | - | - |
| chain | Node.js gateway | 3,338 | 0.78 | 0.75 | -5% | 5% (3) | 170 MiB | 116 MiB | -32% |
| chain | Node.js API | 3,338 | 0.66 | 0.61 | -7% | 13% (3) | 150 MiB | 145 MiB | -3% |
| chain | PostgreSQL | 3,338 | 0.68 | 0.66 | -3% | 3% (3) | 104 MiB | - | - |
| cache-ttl | Node.js service | 5,100 | 0.80 | 0.97 | +22% | 6% (5) | 179 MiB | 190 MiB | +6% |
| cache-ttl | PostgreSQL | 5,100 | 0.29 | 0.29 | +3% | 3% (5) | 386 MiB | - | - |
| cache-ttl | Redis | 5,100 | 0.18 | 0.23 | +25% | 16% (5) | 9 MiB | 28 MiB | +203% |
| pg-mixed | Node.js service | 3,900 | 0.79 | 0.75 | -5% | 4% (3) | 148 MiB | 155 MiB | +5% |
| pg-mixed | PostgreSQL | 3,900 | 0.77 | 0.71 | -7% | 1% (3) | 103 MiB | - | - |
| pg-hot-row | Node.js service | 856 | 0.22 | 0.28 | +27% | 21% (5) | 58 MiB | 74 MiB | +28% |
| pg-hot-row | PostgreSQL | 856 | 0.27 | 0.24 | -10% | 10% (5) | 106 MiB | - | - |
| cache-aside | Node.js service | 5,650 | 0.81 | 0.99 | +22% | 7% (5) | 181 MiB | 158 MiB | -13% |
| cache-aside | PostgreSQL | 5,650 | 0.24 | 0.22 | -6% | 9% (5) | 99 MiB | - | - |
| cache-aside | Redis | 5,650 | 0.19 | 0.23 | +23% | 15% (5) | 11 MiB | 31 MiB | +188% |
| kafka | Node.js producer | 2,088 | 0.72 | 0.99 | +38% | 22% (5) | 175 MiB | 81 MiB | -54% |
| kafka | Node.js consumer | 2,088 | 0.30 | not modelled | - | - | 182 MiB | - | - |
| kafka | PostgreSQL | 2,088 | 0.45 | 0.44 | -2% | 1% (5) | 132 MiB | - | - |
| kafka | Kafka broker | 2,088 | 0.54 | not modelled | - | - | 989 MiB | - | - |
Each part at the highest load step at or below both knees, the measured one and the model's: past the model's own knee its queue holds every request the real service would time out, so its CPU reads fully busy and its memory grows without bound, and the knee error already counts that. Busy cores are CPU seconds per second; errors are (predicted - measured) / measured.
Measured: each container's CPU and working set (memory less reclaimable page cache), read every 5 s inside the window k6 measures. Predicted: ArchSim's predictions, saved before the measurements.
Not modelled: Node.js consumer (inside the model's queue node, which has no CPU or memory); Kafka broker (the model's queue node has no CPU or memory).
The table shows the latest runs (3-4 Nov, engine 0.16.0). On the held-out experiments every part's busy cores are within 8% of the prediction except cache-ttl's service and Redis (+22% and +25%), so their knee errors are not in the CPU per request.
What the numbers say, as written for run 7 (protocol v5, 31 Oct). All four were read inside the measured window of each experiment's latest run, against ArchSim's predictions saved before the measurements.
- Node.js services: close, and too high where the real cost falls with load. Protocol v5 charges every request the service's CPU per request at the top of its calibration staircase, net of what it burns at rest: 0.20 ms in pg-mixed and cache-aside, 0.35 ms in hot-row and 0.47 ms for Kafka's producer. In pg-mixed the real cost stayed at 0.21 to 0.22 ms per request at every step, and ArchSim's busy cores are within 4% (median up to both knees). Elsewhere the real event loop kept getting cheaper as load rose: cache-aside from 0.23 to 0.16 ms, Kafka's producer from 0.59 to 0.36 ms and hot-row from 0.44 to 0.26 ms, so at the top step ArchSim is 24% to 34% high (median 12% to 25%). Under v4 the median errors were 32% to 116%. One core divided by the calibrated cost still sets the predicted knee in pg-mixed, cache-aside and Kafka (4,950, 4,850 and 2,100 req/s).
- PostgreSQL: 16% to 69% low at the top step. ArchSim's figure is low in every experiment:
hot-row 0.07 cores against 0.23, Kafka 0.23 against 0.47, pg-mixed 0.43 against 0.73 and
cache-aside 0.18 against 0.21. Calibration measures PostgreSQL's CPU per query at load (0.18 ms
in pg-mixed's top pass, close to the 0.18 to 0.20 ms per request measured at every step), so
the loss is in how the model turns it into busy cores: as a share of the query time it
simulates (
dbCpuShare). The benchmark divided that CPU by the mean query time the service measured, which counts each write's WAL flush and the measured tail, while the model spends the share of the time it samples: writes without their flush (the flush uses no CPU in the model), from a lognormal whose mean is lower. In hot-row the model spent 0.09 ms of CPU per query against the 0.32 measured. Since engine 0.15.0 (W22) a query's time in PostgreSQL is its CPU per query, so the share is about 1; re-simulated in-sample (development checks, three counted runs each), the top step's median error is -11% for pg-mixed and hot-row, -8% for cache-aside and -4% for Kafka. - Redis: about 90% too low. The model's Redis time per command is what Redis reports as
command time (
INFO commandstats), which leaves out reading and writing the network; the real Redis used about nine times that CPU (0.18 cores against 0.02 at 4,850 req/s). Latency is not affected (the link time carries it), but a Redis node sized from this CPU would be too small. - Memory: ArchSim's service memory is 1.6x to 5.9x too high. The Node.js services' working set grew with the load, up to both knees: pg-mixed from 45 to 145 MiB, cache-aside 63 to 182, Kafka's producer 48 to 179 and hot-row 49 to 66 (V8's heap grows with the rate it allocates at between garbage collections). ArchSim, from its defaults of 256 MiB at idle plus 2 MiB per request held, predicted 258 to 920 MiB: far too much at idle, and growing with requests held rather than with throughput. Redis held 11 to 12 MiB against ArchSim's 10 to 28 MiB (1 KiB per key). PostgreSQL's working set stayed between 92 and 122 MiB and the Kafka broker's about 1.1 GiB; the model has no figure for either.
- Not modelled: the Kafka broker's CPU (0.9 to 1.0 cores at every step) and the consumer's (0.30 to 0.33 cores); queue nodes have no CPU or memory.
Memory is each container's working set: its memory less the page cache the kernel reclaims first, as Kubernetes counts it (anonymous memory is recorded too). In these runs the model's service memory came from ArchSim's defaults (calibration fits it since W24, after these runs) and Redis's from 1 KiB per key, which is not calibrated. Past the model's own knee its service holds every queued request, so its memory there grows far beyond the real one; errors count only steps up to both knees.
How it was measured: since run 5 the runner reads each container's CPU and memory every 5 s inside the
window k6 measures (ResourceSampler). Run 4, kept in the run-N/ folders, recorded each
container's CPU over the whole k6 command, which includes k6's own container start and stop (the
command took 4% to 67% longer than its 25 s of load). compare scales those figures to
the window by the service's own CPU counter (Node's process.cpuUsage, which matched its
container's CPU within 1% in every calibration pass), assuming the containers idle while k6
starts and stops, and resources simulates their predicted CPU again from each run's
calibration (resources-predicted.json), since run 4's predictions did not record it; no
measured step feeds into it. The scaled figures had put pg-mixed's PostgreSQL within 8%; read
inside the window it was 36% off, so treat run 4's scaled figures as rough.
Where the model is wrong, and why#
What the v6 campaign changed (run 8: protocol v6, engine 0.16.0, three counted runs of each, 1-2 Nov 2026, same laptop, OS build and power mode). The rest of this section is the baseline campaign's analysis, and its causes still hold:
- pg-mixed (+6% to +19%; was +20% to +25%): mostly the measured knee moved, not the
prediction. The calibrated CPU per request is the same as under v5 (0.198 to 0.208 ms, against
0.200 to 0.211) and so is the predicted knee (4,780 to 5,055 req/s, against 4,729 to 5,003),
but the real stack held the objective higher: 4,237 to 4,495 req/s, against 3,783 to 4,160.
Nothing on pg-mixed's path got cheaper between the campaigns (PostgreSQL now loads
pg_stat_statements, W22, and the service reports its garbage collection, W21, which both cost a little), so this is the laptop's own variation from one day to the next, about 10%. - cache-aside (-24% to -27%; was -26% to -34%): the higher staircase helped, the falling cost still dominates. v6's staircase topped at 3,023 to 3,350 req/s and read 0.182 to 0.199 ms per request (v5: 0.186 to 0.234 at 1,201 to 1,586 req/s), so the predictions rose and moved less (4,925 to 5,302 req/s); the real cost keeps falling above the staircase.
- pg-hot-row (-9% to -10%; was -19% to 0%): engine 0.15.0's database inputs (W22), first used in a prediction here, and the predictions now agree run to run (851 to 862 req/s).
- Kafka (-2% to -10%; was +3% to +33% against the healthcheck's knees): the first runs without the broker healthcheck's JVM; the real knee rose to 2,614 to 2,802 req/s, and the model's (2,528 to 2,578, the producer's CPU) is now close to it for the right reason.
- Light-load latency got worse for cache-aside. At a quarter and half of the predicted knee
its p95 is predicted at 2.8 to 4.7 ms against 1.4 to 1.5 measured, in all three runs (under
v5 it was within 0.9 ms). Two causes. In the latest run, a harness bug: the first of the three
replicate calibrations saw no full garbage collection, and
median_inputsthen dropped how often one happens, so the model paused the event loop for 9.7 ms every 1,500 requests (Node's default) instead of every 32,500 (fixed after the campaign; re-simulated, the latest run's p95 at 2,600 req/s falls from 4.7 to 3.3 ms; hot-row'srun-9/had the same bug, which moved its p95 below the knee by at most 0.14 ms and not its knee). In every run, the service time's spread: v6's top pass gives a lognormal with p95 11 times its median, and engine 0.15.0's load curve (W21) makes each request 1.4 to 1.7 times as costly at these rates as at the top of the staircase; with both the model's queue grows a tail the real event loop does not have. Without the curve and the pauses the model gives 1.8 to 2.1 ms at a quarter of the knee and 3.1 to 4.0 ms at half, still too high. The spread was the cause (W29, after the campaign): it came from the handler's own time, under a tenth of the CPU per request, and cache-aside's own time also held the wait behind Redis's batched replies, which the model simulates again (11 to 13 times from median to p95, against 2 to 3 for the other three). Anchored so that the model's p95 - p50 at the top calibration pass is k6's (Protocol, step 2), the spread falls to 5.1 to 5.2 times, and re-simulated (in-sample) the three runs' p95 at the first two steps is 1.39 to 1.60 ms against 1.42 to 1.54 measured, and 2.0 to 2.5 against 2.1 to 2.2 at about three fifths of the knee; their median p95 error below the knee falls from between 225% and 328% to between 8% and 23%. The knee barely moves: -1% to +6% in the model's own search, at most 0.4 points of error on v6's measured ladders (one v5 run drops a whole ladder step, -34% to -39%, from a 1% move). pg-mixed, hot-row and Kafka keep their inputs: their model tails at the top pass are no wider than k6's. Kafka's p95 at half the knee is 47% under (2.2 against 4.2 ms).
From the baseline campaign (run 7: protocol v5, engine 0.14.0, three counted runs of each, 30-31 Oct 2026), on one Windows laptop with Docker Desktop set to Best performance:
- Capacity (median knee error): Kafka +4%, pg-hot-row -16%, pg-mixed +24%, cache-aside
-34%. Each has its own cause:
- pg-mixed (+20% to +25% in each run): latency rises before the CPU fills. The model's CPU is
right (above), and its knee is where the event loop's core fills: 4,950 req/s. The real
service's p95 climbs well before that: 2.0 ms at 2,475 req/s, 8.7 ms at 3,712 (with the
service 77% busy) and 65 ms at 4,455, where the model predicts 1.6, 1.8 and 2.3 ms. Garbage
collection, the first suspect, is not the cause: a calibration-only trial with the service
reporting it (W21,
results/trials/W21-README.md) found V8's pauses take 0.1% to 0.45% of the event loop's time, and its p95 at 3,712 req/s was 1.74 ms. At 4,455 req/s that trial overloaded with Node 89% busy and its CPU per request up 31%, and PostgreSQL saturating its two CPUs (hyperthread siblings of one physical core) with its CPU per query up from 0.16 to 0.26 ms. So the likely cause is a CPU cost that rises near full load, in both processes at once: on this laptop its clock falls from about 4,050 to 2,950 MHz as its 8 logical processors fill, and past one busy thread per core the threads share cores (contention, Environment). Giving the model's PostgreSQL its one physical core instead of two logical CPUs does not move the model's knee, which stays Node's (W22's what-if). Engine 0.16.0 can model a machine's threads slowing each other (architecture.host), but the benchmark designs do not use it yet: re-simulated in-sample (with k6's CPU and the machine's background assumed, not measured), it takes pg-mixed from +24% to +11% and PostgreSQL's CPU near the knee from 12% low to about right, while cache-aside goes from -34% to -41% and Kafka from +4% to -22% (IMPLEMENTATION_STATUS.md, W27): the real CPU per request also falls with load, which the model has only up to the top of the calibration staircase. - cache-aside (-26% to -34%): the CPU per request falls with load. The predicted knee is one core at the calibrated 0.20 ms per request (4,850 req/s); the real cost fell to 0.16 ms by then and kept falling, and the real knee was about 7,000 req/s.
- pg-hot-row (-19% to 0%): the row lock is held too long in the model. The model holds the
lock for the write and its commit flush as calibrated (0.33 + 0.85 ms, medians), which caps
the row near 850 req/s; both are timed from the service, so they include network and driver
time that is not spent holding the lock. The real stack held p95 under 4 ms up to 782 req/s,
where the model reached 30 ms. PostgreSQL's own statistics (W22's trial, 31 Oct) show how
much: the UPDATE spends 0.03 to 0.06 ms in the executor and its flush 0.79 ms, while
PostgreSQL's CPU per UPDATE is 0.19 to 0.23 ms, most of it waking up, reading the query and
replying, outside the row's lock. The flush also gets faster with load: 1.06 ms per flush at
196 req/s, 0.79 from about 400 req/s, so a staircase that tops out low (the campaign's first
hot-row run,
run-6/: 221 req/s) measures it too long. Engine 0.15.0 takes Node's driver and network time off the lock (the query's time in PostgreSQL is its CPU per query; the rest of the round trip is the link to the database); in-sample, hot-row's median knee error goes from -16% to -7% (-11%, +10% and -7% over the three runs). The protocol work outside the lock is still held under it: the engine has no part of a query's server time that holds the connection but not the lock. - Kafka (+3% to +33%): two errors that roughly cancel. The model's knee is the producer's
CPU (2,100 req/s at 0.47 ms per request), which is 31% high at that load (above). The real
knee comes from a latency tail that grows with load: the client's p95, which waits for the
publish, rose from 4.6 ms at 525 req/s to 42 ms at 1,890, while the model's stayed between
3.3 and 4.9 ms. That tail was the benchmark's, not Kafka's: the broker's healthcheck started
a JVM every 3 s on the broker's one physical core (about 0.5 cores of CPU). Without it the
stack's p95 was 5.0 ms at 1,890 req/s (W23 trial,
benchmarks/results/trials/2026-10-31-kafka-w23/);compose.yamlruns the check only until it first succeeds from run 8 on, so the kept runs' knee is not Kafka's. The first run's +33% came from its calibration: its staircase topped at 726 req/s rather than about 570, and read 0.35 ms per request rather than 0.46 to 0.47 (predicted knee 2,829 req/s), the falling cost again.
- pg-mixed (+20% to +25% in each run): latency rises before the CPU fills. The model's CPU is
right (above), and its knee is where the event loop's core fills: 4,950 req/s. The real
service's p95 climbs well before that: 2.0 ms at 2,475 req/s, 8.7 ms at 3,712 (with the
service 77% busy) and 65 ms at 4,455, where the model predicts 1.6, 1.8 and 2.3 ms. Garbage
collection, the first suspect, is not the cause: a calibration-only trial with the service
reporting it (W21,
- Low-load latency is within 1 ms, except Kafka's. At a quarter and half of the predicted knee (table after this list) ArchSim's p95 is 0.09 to 0.89 ms off for pg-mixed, hot-row and cache-aside. Kafka's measured p95 was 4.6 ms at 525 req/s and 10.5 ms at 1,050 against the model's 3.3 and 3.4 ms: the healthcheck's tail (above), which the model rightly does not have.
- Criterion 2 hides under-predicted latency. It allows ±100% of the measured p95, and a prediction that is too low can never be more than 100% below. pg-mixed's 3,712 req/s step (1.8 ms predicted, 8.7 measured) and Kafka's steps from 1,050 req/s (3.4 to 4.9 ms against 10.5 to 42.5) pass it for that reason alone; within a factor of two they would fail.
- The model's cliff is sharper than the real one. Past its knee ArchSim's p95 jumps to the 2 s client timeout within one or two steps; the real systems degrade over several steps (pg-mixed 122 ms at 4,950 req/s and 174 ms at 5,445; cache-aside 7.8 ms at 5,335, where ArchSim predicts 1.9 s). So "how far past the knee can I go" is answered pessimistically.
- Kafka's consumers and message age. The consumer kept up with about 1,630 to 1,670 messages/s; ArchSim capped it at 1,383/s from the INSERT and commit times measured at the top of calibration. Below that limit real messages waited longer than the model's (p95 132 ms against 10 ms at 1,050 req/s); above it the two queues grew alike (7.4 s against 6.4 s at 1,890). The client's p95, which the criteria check, does not include this wait. The INSERT and commit inputs are not the cause: with them timed inside PostgreSQL (engine 0.15.0, W22) the cap moves only from 1,383 to 1,404 messages/s in-sample (1,411 to 1,445 and 1,435 to 1,474 in the other two runs). In W22's trial the consumer's INSERTs shared more WAL flushes as load rose (1.0 commits per flush at 237 req/s, 1.5 at 1,200 to 1,500) while each flush grew (0.94 to about 1.2 ms); the consumers' fetch cycle is W23's.
- The predicted range was too narrow (fixed in W28, untested out of sample). It held the measured knee in 1 of 12 runs (nominal 50%). Within a run the three replicate calibration sets agree to a few percent, while the calibration itself moves between runs (hot-row's prediction was 663, 958 and 783 req/s, Kafka's 2,829, 2,140 and 2,102), and the model misses on the same side in every run of an experiment. The W28 range carries both, in about equal parts, so it narrows as calibrations repeat more closely and as the model improves (after a refit).
p95 at the ladder's low steps (at most half the predicted knee):
| Experiment | Offered req/s | p95 measured (ms) | p95 predicted (ms) | Predicted - measured |
|---|---|---|---|---|
| java-mixed | 1,975 (0.25x the predicted knee) | 1.67 | 1.63 | -0.04 ms (-2%) |
| java-mixed | 3,950 (0.5x the predicted knee) | 2.88 | 1.70 | -1.19 ms (-41%) |
| go-mixed | 2,475 (0.25x the predicted knee) | 1.54 | 1.45 | -0.09 ms (-6%) |
| go-mixed | 4,950 (0.5x the predicted knee) | 2.95 | 1.57 | -1.39 ms (-47%) |
| python-mixed | 440 (0.25x the predicted knee) | 2.33 | 6.14 | +3.82 ms (+164%) |
| python-mixed | 881 (0.5x the predicted knee) | 3.13 | 5.90 | +2.77 ms (+88%) |
| chain | 1,112 (0.25x the predicted knee) | 2.58 | 2.42 | -0.16 ms (-6%) |
| chain | 2,225 (0.5x the predicted knee) | 5.38 | 2.47 | -2.91 ms (-54%) |
| cache-ttl | 1,275 (0.25x the predicted knee) | 1.73 | 2.37 | +0.64 ms (+37%) |
| cache-ttl | 2,550 (0.5x the predicted knee) | 2.11 | 2.78 | +0.67 ms (+32%) |
| pg-mixed | 1,300 (0.25x the predicted knee) | 1.71 | 1.66 | -0.05 ms (-3%) |
| pg-mixed | 2,600 (0.5x the predicted knee) | 2.09 | 1.76 | -0.33 ms (-16%) |
| pg-hot-row | 214 (0.25x the predicted knee) | 3.08 | 2.52 | -0.56 ms (-18%) |
| pg-hot-row | 428 (0.5x the predicted knee) | 2.63 | 2.42 | -0.21 ms (-8%) |
| cache-aside | 1,412 (0.25x the predicted knee) | 1.39 | 1.39 | -0.00 ms (0%) |
| cache-aside | 2,825 (0.5x the predicted knee) | 1.54 | 1.45 | -0.09 ms (-6%) |
| kafka | 522 (0.25x the predicted knee) | 2.35 | 1.99 | -0.36 ms (-15%) |
| kafka | 1,044 (0.5x the predicted knee) | 3.56 | 2.11 | -1.45 ms (-41%) |
What engine 0.15.0 changed (the plan's W21 to W24, 31 Oct 2026, each tuned on these four
experiments only; in-sample re-simulation of every kept run in
docs/validation/dev-checks.md):
- Service CPU that follows load (
serviceTimeByLoad, W21), fitted from the calibration staircase. It stays flat above the staircase's top rate, about a third of the knee, so it corrects CPU at light load but moves no knee. - Node.js garbage collection calibrated from the service's own report (W21): too small to move a knee.
- Database inputs timed inside PostgreSQL (W22): a query's time in the database is its CPU per query, the rest of the measured round trip is the link, and the WAL flush is PostgreSQL's own. PostgreSQL's predicted busy cores at the top step went from 16% to 70% low to 4% to 11% low, and hot-row's median knee error from -16% to -7%.
- Kafka (W23): message age from the start of the publish, and consumers that poll in
cycles as kafkajs does. The publish tail that grew with load was the benchmark's healthcheck,
fixed in
compose.yamlrather than modelled. - Sizing inputs (W24): Redis's CPU per command including its network work (from 90% low to 14% to 19% high) and each service's memory fitted over the staircase (from 1.6 to 5.9 times too high to 10% to 76% too low near the knee).
What would make it better next, in order:
- A CPU cost per request that rises near full load (pg-mixed's +24%), and how hyperthreaded vCPUs turn into capacity, for services and databases alike: a cloud vCPU is a hyperthread too. The held-out campaign puts this first: java-mixed (+70%), go-mixed (+67%) and python-mixed (+29%) ran on the two hyperthreads of one core, and chain's +30% needs a cause of its own.
- A CPU per request that keeps falling with load above the calibration staircase
(cache-aside's -34%). Protocol v6 (W26) calibrates to about two thirds of the core, which is
estimated to bring cache-aside to about -20% (protocol history, above). The rest of the fall
comes above that: between half and three quarters of the core pg-mixed's cost fell too (0%
to 7% in its ladders, like cache-aside's 5% to 12%), and only above three quarters did it stop
falling while cache-aside's kept going, so a staircase that stops at two thirds cannot tell
them apart. W26's
extend_load_curvecarries a clear fall on, at most one measured stretch; on staircases built from the kept ladders it moved cache-aside's core-full rate from 18% to 10% below the knee (median, ladders cut at 70% of the core; cut at 65% it fired in one run of three), left pg-mixed alone and does not fire on Kafka's or hot-row's v6 staircases (under 45% busy). It is off by default until the v6 campaign's own runs show the same (the log form, passed the staircase and the service's CPUs as the harness'sCurveFormdescribes, thenresimulate). - A calibration whose inputs move less from run to run: much of the service's CPU variation is where the staircase stopped (W26 calibrates closer to the knee). The predicted range (W28) now carries that variation and the model's error; it holds 9 of the 12 runs in-sample and 9 leaving out each experiment. On the held-out campaign it held 9 of 15 (nominal 80%), every miss java-mixed's or go-mixed's, whose measured knees fell below the range.
- Memory near the knee (a Node.js heap grows faster than linearly with load), a flush and a CPU per query that fall with load, and Kafka's rare consumer stalls (message age at mid load).
Limits of this evidence: one machine; three runs of each held-out experiment and six of each tuned-on one under protocol v6 and engine 0.16.0; Windows with Docker Desktop (a virtual machine between the containers and the hardware) whose power mode (with k6 moved off the service's core) moved two knees by 45% to 65%; small synthetic services; and k6's own summaries are not kept, only the numbers taken from them. The four tuned-on experiments are in-sample for the protocol and the engine, the five held-out ones are not. It shows that on this machine engine 0.16.0 predicts the four tuned-on knees within 25% and one of the five held-out ones (median of their runs), and that on stacks it was not tuned on it errs towards promising too much capacity. It does not show how ArchSim does on other machines or on real applications.
Proposed tier thresholds#
The owner decides tiers; this is a proposal, not applied anywhere.
A technology is validated when every benchmark that exercises it has, over at least three counted runs under the same protocol, machine, OS build, power mode and engine:
- a median knee error within ±25%;
- at or below the measured knee, every step's predicted p95 within a factor of two of the measured one (from half to double) or within 3 ms of it, whichever is wider (so sub-millisecond noise does not fail it), in at least two of three runs;
- no unstable step at or below the measured knee, in at least two of three runs (3a), and a run under the same protocol on a second machine, or the hosted runner (3b).
Criterion 2 is symmetric: predicting half the measured p95 misses as much as predicting double (ADR 0018). Until 2 Nov 2026 it read "within ±100%", which a prediction that was too low could never fail. pg-mixed and Kafka passed it that way and fail it now: pg-mixed at 3,788 req/s (2.0 ms predicted, 30.7 measured) and Kafka at 1,894 and 2,272 req/s (2.8 and 4.7 ms predicted, 14.5 and 28.7 measured).
Computed by the harness's report from each experiment's latest run and its kept runs:
| Experiment | 1. Median knee error within ±25% (3+ runs) | 2. p95 within a factor of two or 3 ms at or below the measured knee (2 of 3 runs) | 3a. No unstable step at or below the measured knee (2 of 3 runs) | 3b. Reproduced on a second machine, same protocol | All three |
|---|---|---|---|---|---|
| java-mixed | no (median +70% over 3 runs) | yes: 2 of 2 steps within; 2 of 3 runs pass | yes: none unstable; 3 of 3 runs pass | no: 3 runs under v6, on 1 machine | no |
| go-mixed | no (median +67% over 3 runs) | yes: 2 of 2 steps within; 3 of 3 runs pass | yes: none unstable; 3 of 3 runs pass | no: 3 runs under v6, on 1 machine | no |
| python-mixed | no (median +29% over 3 runs) | no: 440 req/s miss (2 of 3 steps within); 0 of 3 runs pass | yes: none unstable; 2 of 3 runs pass | no: 3 runs under v6, on 1 machine | no |
| chain | no (median +30% over 3 runs) | no: 3,338 req/s miss (2 of 3 steps within); 0 of 3 runs pass | yes: none unstable; 3 of 3 runs pass | no: 3 runs under v6, on 1 machine | no |
| cache-ttl | yes (median -6% over 3 runs) | yes: 5 of 5 steps within; 3 of 3 runs pass | yes: none unstable; 3 of 3 runs pass | no: 3 runs under v6, on 1 machine | no |
| pg-mixed | yes (median +16% over 6 runs) | no: 3,900 req/s miss (2 of 3 steps within); 0 of 6 runs pass | no: none unstable; 3 of 6 runs pass | no: 6 runs under v6, on 1 machine | no |
| pg-hot-row | yes (median -10% over 5 runs; 1 disturbed run not counted) | no: 856 and 942 req/s miss (4 of 6 steps within); 0 of 5 runs pass | no: 942 req/s unstable; 2 of 5 runs pass | no: 6 runs under v6, on 1 machine | no |
| cache-aside | yes (median -23% over 6 runs) | no: 5,650 and 6,215 req/s miss (4 of 6 steps within); 0 of 6 runs pass | yes: none unstable; 6 of 6 runs pass | no: 6 runs under v6, on 1 machine | no |
| kafka | yes (median -3% over 5 runs; 1 disturbed run not counted) | no: 1,566, 1,879 and 2,297 req/s miss (3 of 6 steps within); 0 of 5 runs pass | yes: none unstable; 5 of 5 runs pass | no: 6 runs under v6, on 1 machine | no |
A technology meets the thresholds when every experiment that exercises it meets all three: Java (Spring Boot) (java-mixed); PostgreSQL (java-mixed, go-mixed, python-mixed, chain, cache-ttl, pg-mixed, pg-hot-row, cache-aside, kafka); Go (go-mixed); Python (Flask, gunicorn) (python-mixed); Node.js (chain, cache-ttl, pg-mixed, pg-hot-row, cache-aside, kafka); Redis (cache-ttl, cache-aside); Kafka (kafka). None meets them on this data.
The criteria check the client's p95 only. Kafka's consumer side (consumed per second, message age) is further off (above: the consumer capped at 1,383 messages/s where it kept up with about 1,650/s, and message age 13 times the model's at 1,050 req/s), so Kafka would stay experimental for asynchronous questions even if it met all three, until the consumers' fetch cycle is modelled (W23). On this data the core set stays a focus list, as the badge says today.
Commit IDs in recorded results#
The repository's history has been rewritten twice. Each rewrite changed every commit's ID, and neither changed the code.
- On 2 Nov 2026 every commit message was rewritten to Conventional Commits. The rewrite also
mapped the IDs recorded in the results to the new ones, among them in 24 sealed
predictions.jsonfiles, three lines each (provenance.commit, the design's commit andprovenance.harnessHash). Those 24 no longer match theirpredictionsSha256: each seal matches its file as written before the rewrite, which a backup of the old history keeps byte for byte. - On 13 Nov 2026 the author's email became GitHub's noreply address, two documents not meant to
be public left every commit, and every commit carries the AGPL-3.0 licence. Recorded results
(
benchmarks/results/,benchmarks/knee-range.jsonand the accuracy and knee-range files generated from them) keep the IDs they had, since a run'spredictionsSha256seals itspredictions.jsonas written;benchmarks/results/commit-ids.tsvmaps each recorded ID to the commit's current one. The rewrite also changed the trees of the engine sources thatbenchmarks/engines.jsonrecords;benchmarks/results/tree-ids.tsvmaps each recorded tree to today's, and the held-out check compares through it.
IDs written by hand, here and in the other docs, name the current commits.
Two more seals do not match, for another reason. Cache-aside's run-4 and run-5 extended their
load ladders after their predictions were sealed, and the harness appended the extension steps to
predictions.json without sealing it again, so each seal covers the file as it was before those
steps. That is a bug of the Python harness. The Java harness seals each extension too: before it
measures a step above the ladder, measured.json's extensionSeals records the step and the
sha256 of predictions.json with that step in it, so every seal matches the bytes it sealed.
Every other sealed run matches its seal.
On 13 Nov 2026 the local paths in nine files of the calibration-only trials
(benchmarks/results/trials/) and in one performance profile (benchmarks/perf/baseline.json)
were replaced by placeholders (<home>, <repo>, <temp>, <runtime>, <plugins>). Nothing
measured changed.